I sell Essential Energy Services and double down on Linamar and Foot Locker. I claim to rarely be mistaken even though I am frequently wrong. I wonder whether overweighting cash is really a defensive move in this environment and I use my new stock screening spreadsheet to showcase the process I use to find new investments.
Longest. Holding Period. Ever.
I finally sold my stake in Essential Energy Services. This company officially wins the prize for longest sojourn in the portfolio. I first bought Essential back in 2015 in the aftermath of the oil price bust. I bought into the stock at the bargain price of 75 ¢ a share, a steep discount to the $3.00 share price it had traded at a year earlier.
This was a turnaround play; a bet on a recovery in the oil patch. The company was losing money but was trading at half of book value and had a healthy balance sheet to support it through the lean times. It wasn’t my only bet on the oil sector. I bought a number of other service companies at about the same time and some of those did quite well, but sadly, Essential never managed to regain its footing.
Oil prices did stage a comeback of sorts. In 2018 the price had risen back to the $80 mark (still down from $120 five years earlier), but the recovery was slow to materialise and the industry never fully regained its old luster, especially in Canada where a lack of takeaway capacity and heavy competition from frenetic fracking activity south of the border kept a lid on the rebound.
Still, I remained hopeful that a healthy glow would eventually return to the sector and Essential always seemed to offer the promise of mouth-watering gains if and when that ever happened. I held on through the muted recovery of 2017/2018 and then rode this puppy all the way back down again when the coronavirus technically sent the price of oil below $0 for a brief time.
As the price of oil has climbed back up over the last two years, I’ve continued to grimly hold on to Essential. The same reasoning that applied for the 6 years before still seemed valid. And with years of under-investment in the sector, an explosive move upwards in the price of oil seemed possible. Over the last two weeks, the Russians have accelerated that process and that explosive move higher is now here.
So why am I getting cold feet now? After 6 ½ years of waiting, full vindication seems to be within my grasp. But instead, I’ve cashed in my chips just as the ball was getting rolling. As the share price moved over 50 ¢ this week, I began selling and on Thursday finished unloading the tail end of my position at the 44 ¢ mark.
Partly this has to do with the liquidity of the stock. Over the past 6 years, as the size of my portfolio has grown and the share price of Essential has dropped, this holding has become an increasingly irrelevant piece of the portfolio. More of an annoying distraction than a potential money maker. I would have added to the position at many points over the past couple of years, but I am very wary of getting trapped in something I can not easily get out of. On the other hand, it always seemed so cheap that I felt I couldn’t justify selling it. I’ve been stuck in a state of limbo with this stock. One foot in, one foot out. Finally, at 50 cents, it crossed that hazy line where I felt it was close enough to fair value that I could justify cleaning house and moving on.
Over the past 6 years the picture at this company has definitely changed, and not for the better. The fossil fuel industry is facing an uncertain future. If we can source enough nickel, copper and the like to build them, then electric vehicles could put a massive dent in fossil fuel demand. It is cheaper in many places now to build a solar generating station than it is to build a natural gas power plant. And a hell of a lot quicker. It takes several years to design, engineer and build the complex machinery required to get a natural gas plant off the ground. You can slap some solar panels in a farmer’s field and hook them up to the grid in a few months.
Meanwhile, Essential’s book value continues to erode. Their mothballed rigs must be getting somewhat long in the tooth at this point. If the energy sector does stage a full comeback, there may be a bunch of new players that appear with shiny new equipment to give Essential a run for its money. Their just-released year end results do not paint an overly inspiring picture. Costs are up, manpower is hard to find, and customers are refusing to pay what is needed to cover these added costs. Energy players are still being cautious; they don’t want to commit to new exploration and production when the future of their industry is in doubt.
At its peak, Essential was making a return on equity of 7-10%. But book value has declined substantially over the past 6 years. Some of that may be an accounting illusion as depreciation outpaces the actual decline in the earnings potential of their unused rigs. But much of it may reflect a real loss of earnings power. Putting an ROE of 7% on current book value gives potential earnings of only 6 ¢ a share. And that is assuming activity returns to 2013 levels, something that is far from assured. This stock was never an investor darling. At its peak, it sported a p:e of around 10. So again, there’s reason to temper one’s expectations here. A p:e of 10 on EPS of 6 ¢ gives a share price of 60 cents, not much above the recent share price.
Granted, I’m using conservative estimates here, and a rip-roaring energy renaissance could see Essential blowing past these goalposts, but given that I can’t fully get on board this stock because of its thin trading volume, and I don’t like this one foot in, one foot out kind of existence, I used the recent price strength to stage my exit.
I’ll be on the lookout for a replacement though. I was disappointed to have to abandon Enerflex a couple of months ago. Now, with the sale of Essential, I have no exposure to the oil and gas sector at all and that makes me uneasy. With years of under-investment it seems we are quite likely to see a punishing period of fuel shortages and sky-high prices at some point in the future. Or now, actually.
So Did I Make A Mistake?
Readers have asked me what some of my biggest mistakes have been and I always scratch my head to come up with a good answer. I’m frequently wrong but I feel I rarely make mistakes. And miraculously, with that outlook on life, I’m still married.
The truth is that if I was doing it all over again, I think I would make exactly the same decisions. I never labour under the illusion that I can predict the future. Many investors approach investing with the mindset that success involves correctly predicting whether the price of oil or the price of a stock will go up or down. Whether the economy will expand or contract. Whether the Fed will raise or lower interest rates. I don’t look at things that way. I see my job as evaluating the wide range of future possibilities that might be in store for any given company and then looking for stocks where the share price does not accurately reflect that range of outcomes.
I didn’t know back in 2015 with oil prices crashing and red ink washing over the sector what the eventual recovery might look like. Whether it would be quick and painless or long and drawn out, whether prices would fully recover or only partially recover or indeed, recover at all. I didn’t know if Essential would outperform the sector or underperform, although I liked their chances. And I certainly didn’t know what the landscape might look like 6 years down the road. But I did have a sense of what the range of possible outcomes might be and I felt that the company had some compelling characteristics (positive cash flow and a strong balance sheet) and the share price offered an attractive enough entry point that it weighted the probabilities in my favour.
It didn’t turn out that way for Essential, but it did for a number of other similar plays made around the same time (Questor, PHX Energy Services, Macro Enterprises, High Arctic Energy Services).
I’ve only been right 60% of the time. That is, only 6 out of every 10 stocks I buy actually go up. That’s not a great track record, but apparently, it’s enough to deliver market beating performance over many years. I rely not so much on trying to predict the future as I do on trying to find things that seem cheap relative to past performance. I run through scenarios in my head. “What if this happened, then what would the stock be worth?”. “What if this other thing happened?”. “What if the economy did this? What if it did that?” And so on. If the share price seems undervalued to a greater or lesser degree based on a variety of reasonably plausible scenarios, then I’ve got a potential winner on my hands. I may be wrong in buying it, if future events don’t play out in my favour, but if my thought process was valid, and if I’d make the same decision again when faced with the same set of facts then I have a hard time saying I made a mistake in buying it.
Covid Hangover
Many companies are now reporting rising costs and falling profit margins on the other side of the covid sugar rush. I’ve tried to avoid the more obvious candidates for the hangover effect (video conferencing, exercise equipment, hand sanitizer companies) but even so, my portfolio has hardly been immune to these effects. Linamar, for example, reported very weak fourth quarter earnings on the back of chip shortages and supply chain disruptions that are hitting their agricultural equipment division particularly hard. They see this continuing for the next couple of quarters but remain upbeat about the prospects for their industry once supply chains get sorted out. They see massive pent-up demand for new vehicles driving strong growth over the next few years.
If I run the same sort of back of the envelope analysis for Linamar that I did for Essential, the numbers work out much better. Linamar’s return on equity averaged 13% during the business expansion of the early 2000’s and hit 19% for a few years during the most recent business cycle. If I split the difference, I get a target ROE during the next up cycle of 16%. On a trailing basis, we’re down around 8% now. Coming out of the last recession, book value doubled over the course of 4 years. If I use a more modest projection of 50% growth over the next few years and apply a 16% ROE to that, I get potential EPS of $16.80. Slap a lowball p:e of 10 on that and you get a share price of $168 a few years down the road, for a nice 3 bagger from current levels. I’m using a very low p:e ratio here for my modelling because the whole conventional auto industry seems to be plagued by perennially low p:e ratios, but if a wave of EV adoption redefines the industry, that could change, giving the stock an even greater boost.
I used some of the proceeds from my Essential and Enerflex sales to double down on Linamar.
Foot Locker
I also doubled down on Foot Locker. This one I’m a little less confidant of. Year end results included the very unpleasant news that Nike will be pulling a significant amount of its business out of Foot Locker’s stores come next Christmas. Nike is going to be focusing on their own online direct to consumer sales and Foot Locker is going to suffer the consequences. The stock price immediately dropped 30% on this sorry news.
This highlights the danger whenever a company is overly reliant on one customer or one supplier. At one point, NIKE was responsible for 75% of Foot Locker’s sales. After the NIKE pullout, they say the percentage will be more like 50%.
When I bought into Foot Locker, I had hoped that the heavy reliance on a single supplier was already priced into the stock given its very low p:e ratio. Evidently not. In this case, given the recent news from NIKE and the stock’s reaction to that news, I was clearly wrong to buy the stock in the first place, but did I make a mistake in making the decision to buy it? I’d argue no. I appreciated the risk and opted to take it anyway because of the very low price. It was a risk/reward calculation that didn’t end up working in my favour, but could have. And so, with that verbal sleight of hand I can persuade myself that I am smart even when the stock chart is screaming at me that I’m an idiot. These are the kind of psychological games that I think help you to last in this business.
No doubt this all means trouble for Foot Locker. Earnings are almost certainly going to take a hit next year and possibly even more so the year after. How much of a hit is hard to say. But despite this, I still think Foot Locker is cheap. Cheap on a price to book basis, cheap on a price to sales basis and cheap on a price to earnings basis, even if I use projected earnings that are half the current level. I think Foot Locker still has some fight left in it. They’ve got some higher growth acquisitions to play with, they’re expanding their apparel business, they’ve got other brands like Adidas, New Balance, PUMA and Crocs to work with. And NIKE is not abandoning them entirely.
So I’ve added to my Foot Locker position, enough to bring it back in line with my other holdings.
The Wolf At The Door
No discussion of current market conditions would be complete without talking about the inflationary wolf at the door. Many of us have no real experience with inflation. My vague memory of it mostly involves Richie Rich comic books and Aero chocolate bars. But inflation is back with a vengeance after a nearly 40 year hiatus. Will it last? I’m still not in the camp that sees a repeat of the inflationary 70’s as a done deal. But it’s definitely on the table now as a real possibility. The covid distortions seemed reasonably likely to be a one-off type of thing but the atrocities occurring in Ukraine may have changed everything. I don’t know what the long-term ramifications of this are going to be but if we’re not all immolated in a nuclear fireball, we may be dealing with the fallout from this conflict for years to come. War is an expensive proposition. And the only way to pay for it may be with printed money.
With the sale of Enerflex and Essential I once again find myself with more cash than I usually carry in the portfolio. It used to be I would call this a “defensive” stance and with stock prices coming off a period of record highs, a defensive stance does not seem to be a bad thing.
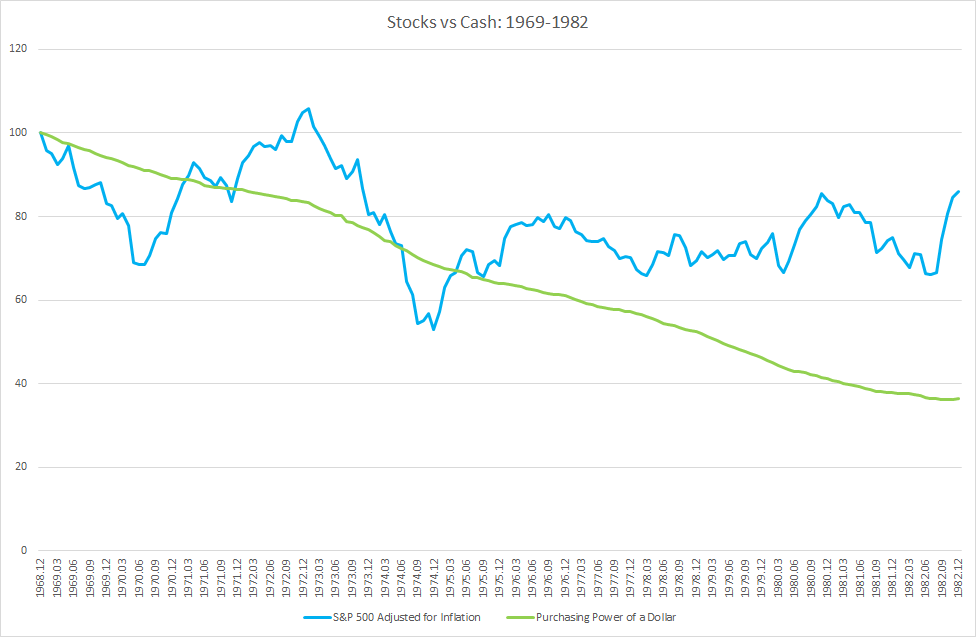
However, persistent inflation would re-write the rules on that. You can’t really call cash “defensive” in an inflationary environment. In the inflationary outbreak of the 1970’s, it was a real horse race as to which would lose money faster, a diversified stock portfolio or the purchasing power of your cash.
The Buffett Indicator
The Buffett indicator (the ratio of total stock market capitalisation to GDP) has recently rolled over. A top of some sort seems to be in. Will it be a head fake like we saw in 2011, 2015 and 2018 or is this the start of something more significant?
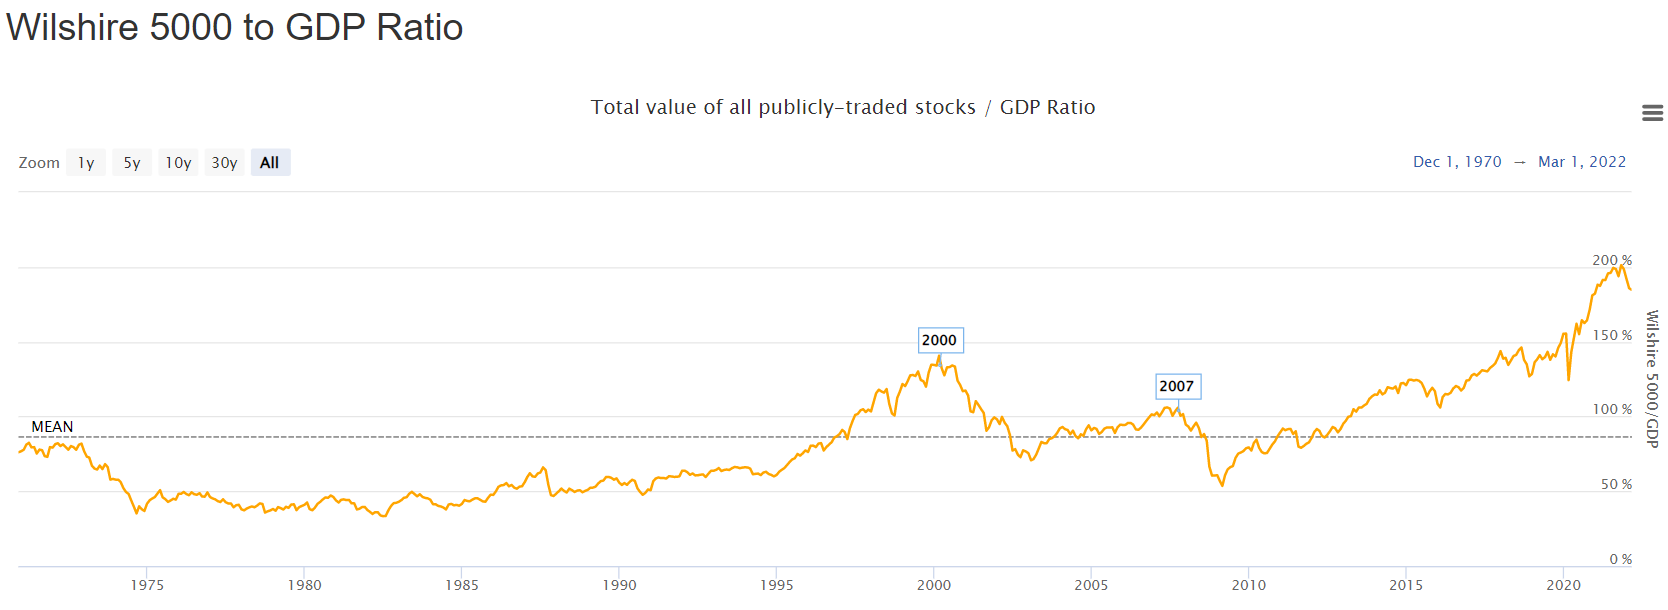
Source: The Buffett Indicator: Market Cap to GDP – Updated Chart | Longtermtrends
The indicator topped out at 200% recently. At its trough in 2009, it hit 50%. Given that GDP moves relatively slowly, most of the heavy lifting required to move the ratio from 200% back down to 50% would have to come from falling stock prices, at least in the short term. A fast and furious retracement of the big 2010’s bull market could therefore involve a 75% drop in general stock market prices. Nasty.
But an inflationary bear market might be a little less gut wrenching. If inflation were to start ripping along at 5-10% per year then, given enough time, a lot of the heavy lifting required to get that Buffett Indicator back down to a more reasonable level could come from rapidly growing nominal GDP, not from crashing stock prices. (ie the price of everything except stocks goes up.)
The most likely scenario seems to be some combination of these two extremes, which could produce a stock market graph somewhat like the 1970’s experience pictured above.
The challenge for investors is going to be to stick-handle their portfolios through the stormy seas ahead. Next week, I dive into a review of year end results. I’m fairly happy with the stocks I have in my portfolio at the moment and also reasonably happy having a moderate overweighting in cash, so the pressure is off to come up with a bunch of new investment ideas. If I find anything new to buy, I’ll have to decide whether or not to re-deploy some of my cash, sell one of my existing holdings or just shuffle things around.
Narrative Investing
I’m not a big fan of narrative investing. By narrative investing I mean latching on to some grand theme like “green energy” or “work from home” or “the Russians are bombing the hell out of Ukraine and this is going to send worldwide commodity prices soaring”. And then trying to find companies that would benefit from that theme. In general, I don’t find that this works very well. The market is scarily efficient for the most part and stock prices often react to dramatic new developments in a fairly quick and sensible fashion. For the most part, I suspect the new world order, as dramatic a change as it is, has likely already been priced in to most stock prices. That’s not to say I won’t be keeping an eagle eye out for investments where that might not be the case but then that’s what I always do: I look for companies where the share price does not accurately reflect their future prospects. For certain companies, those future prospects have changed dramatically in the past 2 weeks.
I like to say that I let the market tell me what to buy. At the start of a review, I don’t know what I’m going to find, if anything. Heading into my next review, I’m certainly going to be paying close attention to the commodity space, especially commodity service companies as I don’t particularly like buying the actual producers. Heavy equipment distributors, modular workforce accommodations, farm supply stores and hydrovac trucking companies are a few examples that spring to mind. Defense spending is another area in the “narrative investing” space to be aware of. I know I was looking at Lockheed Martin last review. I’ll be looking at that again. On the flip side of the coin, if commodity prices are going to rise dramatically or at least stay at their current high levels for longer then this promises to squeeze the profit margins at a whole host of companies including my current favourite, Linamar. And those poor airlines are going to get hammered even further by these high oil prices. All things to keep in mind. But I remain open to any and all possibilities. If I end up finding a new fracking company, or better yet, a company involved in the renewable energy space, both of which might benefit from nosebleed oil prices, then great. If instead I come up with a chain of beauty salons then that’s fine too.
Whatever I might find, I always look forward to the hunt. And this coming review more so than ever as I have a shiny, new toy to play with…
Man And Machine
I spent a good part of this winter extensively re-writing the program I use to screen for new stock ideas. I use a heavily customised excel spreadsheet with a bunch of visual basic macros that I’ve written to sort and collate the data behind the scenes and present it in the way I like to look at it. I use GuruFocus as my data provider and before I get to work every quarter, reviewing company results, I set my program to downloading and organising all this data. With the revamped version of my spreadsheet I’ve got access to a lot more data than I had before, that I can now see and graph with the push of a button. Things like inventory levels, rates of depreciation, purchases of new equipment and so on. It’s all there at my fingertips. Now it’s my job to make sense of it all.
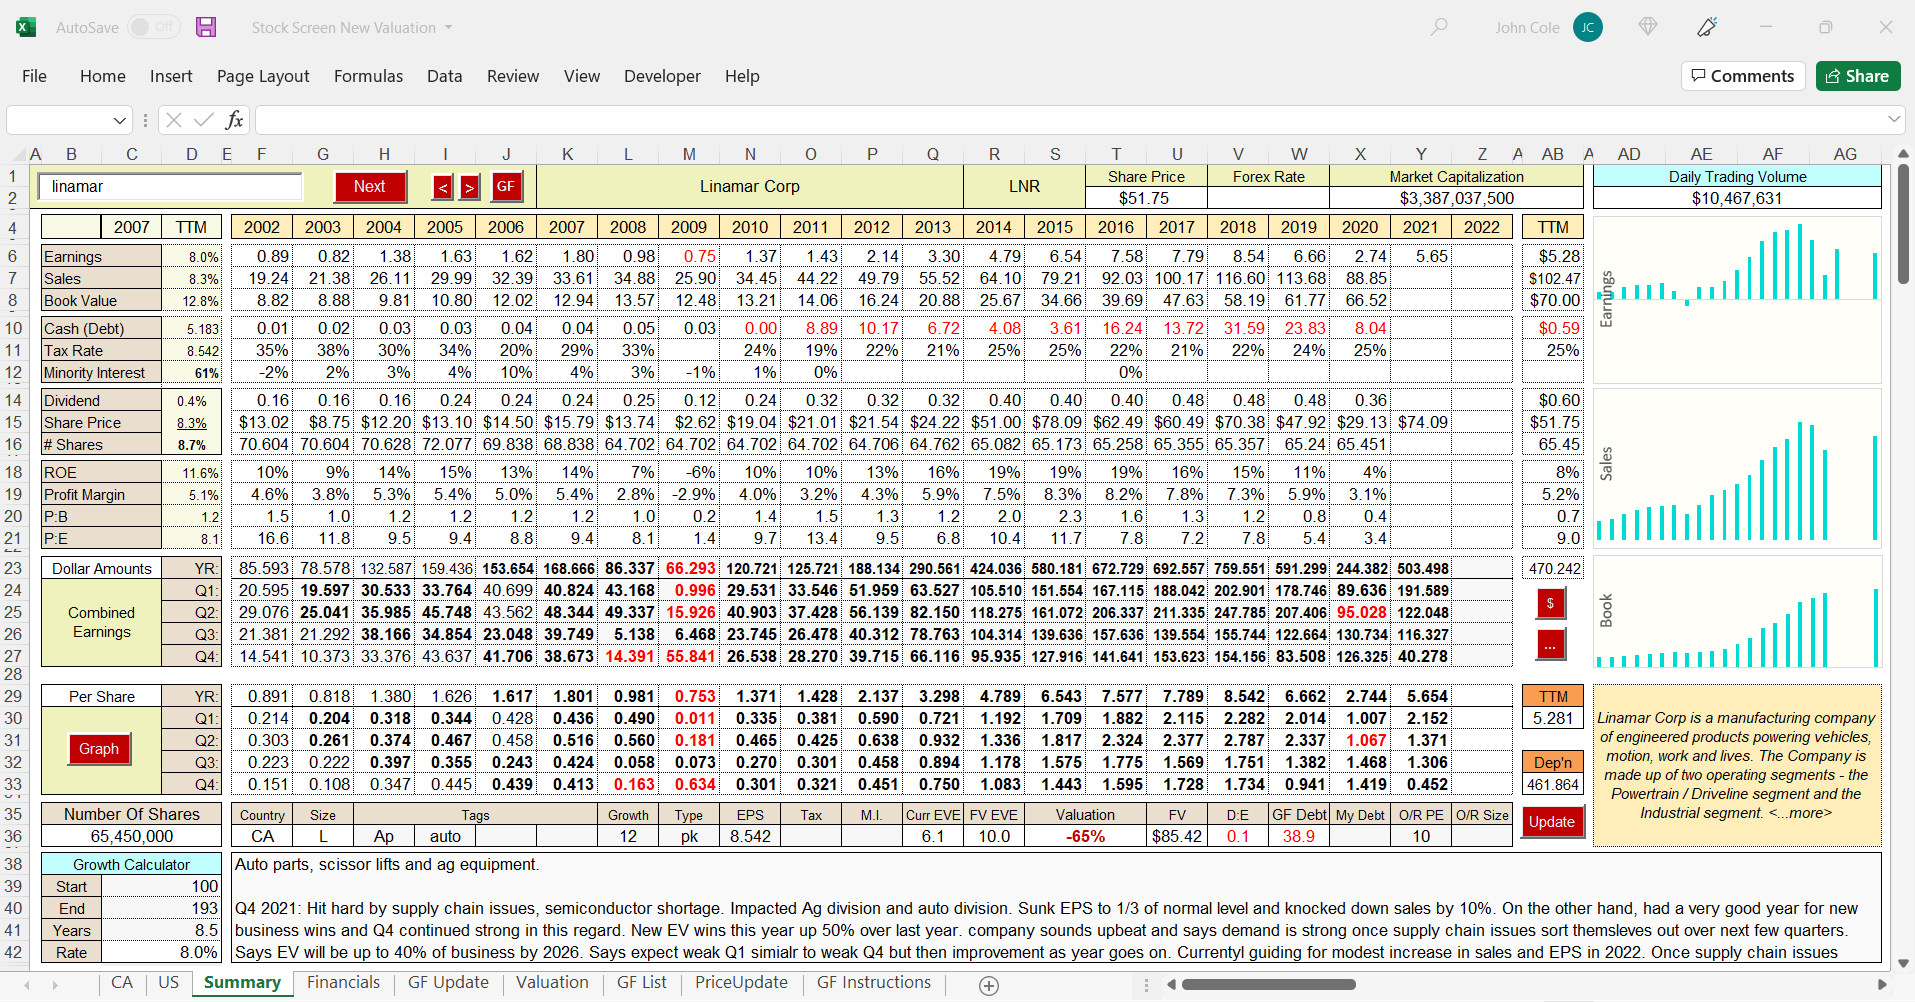
A screenshot of the dashboard of my new and improved screening program. I favour the ValueLine / Tim Ferris approach of trying to cram everything that’s worth knowing about a stock or subject onto a single page. If I want to do a deeper dive, one of those red buttons brings up a menu where I can select any of about 70 other pieces of financial info that might flesh out the picture a bit further.
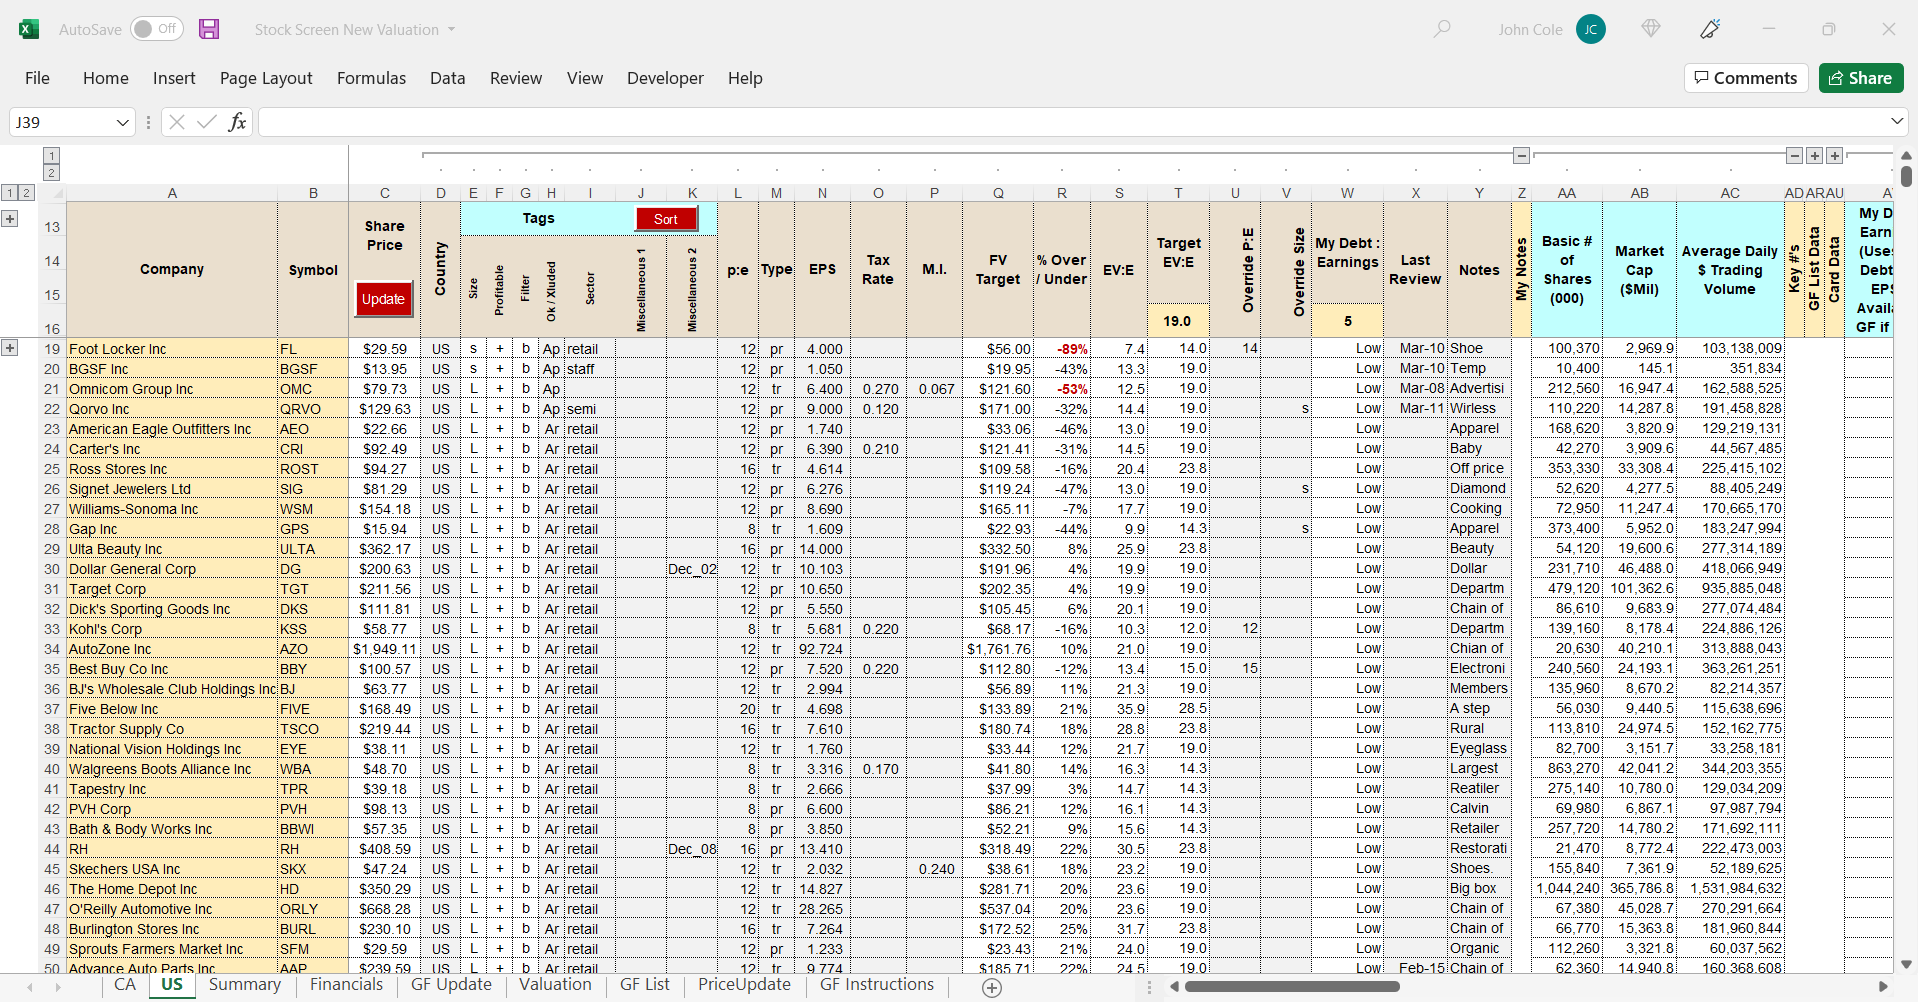
And a view of the back end. Every stock gets its own row. That way I can sort and organise by sector, growth rate, debt level, etc., etc. Don’t squint too closely at the actual numbers. They’re quick, back of the envelope estimates and are all 4 months out of date anyway.
Searching for a Needle In The Haystack
My quarterly review process is basically a two stage affair. The first step is to go through a long list of companies and assign each of them a rough estimate of fair value using information from the dashboard pictured above. The dashboard gives me a 20 year snapshot of the company showing the major drivers of corporate health: sales, earnings, book value and debt. I form an opinion of how fast the company has been growing or might grow in the future based mostly on the past track record. I come up with an estimate of what baseline earnings I’m going to use. Typically, I’ll use peak or trailing earnings although I’ll often look at historical profit margins as well and may modify my earnings estimate based on those. If the stock is looking potentially interesting based purely on the numbers I’m seeing then I’ll take the time to find the latest set of financial statements so I can make my own earnings calculations and see if they agree with what the company has reported. If not, I enter my own earnings number in the spreadsheet. I’ll also read through management’s comments from the most recent quarterly or annual news release to get a sense of the direction the company is going in and the issues it’s facing right now. I put this all together and take an initial stab at what I think the fair value of this company might be. I then move on to the next stock in the list.
After I’ve gone through this initial screening process for all the companies in my target universe, I’ll go back and look at the few dozen companies that made it to the very top of the value rankings. That is, those stocks that are trading at the biggest discount to my quick estimate of fair value. This is the second stage of the process and generally takes about the same amount of time as the first stage even though I’m looking at far fewer companies. Here, I’ll go into a lot more depth, reading through news releases, digging through annual reports and making copious notes. Most companies will fall by the wayside for one reason or another but if I’m lucky one or two might make it to the end of this grueling screening process and I’ll have myself a new candidate for entry into the portfolio.
It’s the first part of this process that I use my spreadsheet for. I’m using it to find those 2 or 3 dozen companies that I really want to explore in detail. Once I find them, a hot cup of coffee, a blank WORD document to take notes with and a comfortable spot to sit are all I need.
Before I even begin this whole process, I need to come up with a starting list. Between the main US and Canadian exchanges there are over 8000 companies to consider. Far more than I could hope to look at individually. So I need to narrow the field somehow. I can weed out a lot of companies with a simple sector sort. I tend not to look at companies in the resource exploration and production sectors. (Although I will probably make a special exception during the next review in light of recent developments.) I also mostly ignore the real estate, financial, biotech and utility sectors. This cuts the list by about half. I also exclude companies with insufficient trading volume. Particularly in Canada, this narrows the playing field quite a bit further. There are a lot of great micro caps in Canada that are now unfortunately out of my reach. After these two sorts I’m still left with a few thousand companies to consider. I can cut this in half again by introducing a debt to earnings cutoff. Generally speaking, if the debt to earnings ratio is over 5, I’m not likely to be interested. However, “earnings”, especially company reported earnings, are a slippery construct. I’m probably excluding some possible investment candidates with this debt to earnings criteria but I have to winnow things down somehow. I could use a debt to equity cutoff instead but this would come with its own set of issues.
After the debt sort, I’m down to around 2000 stocks. If I ignore companies that are losing money, this cuts another 500 or so off the list. (Although I’ll often make a very speedy pass through these rejects just to make sure I don’t miss a good turnaround opportunity.)
I’m down to around 1500 stocks at this point. That’s still a lot of stocks to go through each and every quarter, but the spreadsheet I have makes it fairly quick to cycle through them, especially if I’ve looked at them before. Still, it’s a good week’s work to sort through this list and come up with a few dozen that really stand out and merit deeper investigation. This screening part of the process is what I’d like to streamline more if I can. I’m hoping the new version of my spreadsheet will help with that.
I’ve been helping some friends get started in the investing game and I’ve recommended that they start with a much more manageable field of candidates than I do. I tell them to find a smaller niche that contains maybe a couple of hundred stocks and work through that. Get comfortable with that group of companies over the course of a few quarters and then gradually expand their areas of expertise. For Canadian investors, starting with profitable micro cap stocks is a great way to get started. If you exclude the resource sector, biotech, real estate and financial sectors, you’re left with a pretty manageable list of a couple of hundred companies that you can search through for possible winning investments. Over time you can move up the market cap ladder or delve more into the resource sector or even expand into the much larger (and more intimidating) US market.
Of course, no one else has access to the spreadsheet I use but you don’t need it; it just makes my life a little easier. There’s been a new website that launched recently called TIKR.com. I’d highly recommend it for this sort of screening investigative work. It has much of the same functionality as the spreadsheet I use, with historical financial data, graphing capabilities, conference call transcripts and links to company quarterly and annual reports. It also has a great screening tool. It does cost a few hundred dollars a year to get all the features (there is a basic, free version which you can use to check it out ), but you get a lot of bang for your buck. And no, unfortunately I don’t get any kickbacks!
Not Out Of A Job Yet
The new version of my spreadsheet lets me program in fairly complicated screening algorithms. With my basic sector sort, trading volume and debt:earnings sort I can get the list of stocks I need to review down to around 1500. It would be awfully nice to get this down even further. 500 would be a very manageable number and would give me more time to really dig into some companies in greater detail. In the past, though, I’ve always found that the more specific I get (ie introducing things like a p:e cutoff) the more false negatives I get. Companies start to get excluded in the screening process that actually might have made good investments. So I’ve always pulled back from this whenever I’ve tried it in the past and instead resorted to the brute force method of starting with some very simple screening parameters and then working through the large list of stocks this produces on a case by case basis. Still, developing a more effective screening algorithm is a goal that I will continue to work towards.
Taken to an extreme, what if you could program in a comprehensive enough screening algorithm that it could actually pick winning stocks for you? No more toiling away in front of the computer. Push a button and call it a day. That is the holy grail of quantitative investing. I made a fresh attempt at this with my new screening program. I tried to re-create the thought process that I go through when I’m evaluating companies, looking at previous profit margins and applying them to the present, calculating peak earnings where appropriate, using trailing earnings where appropriate and in some cases using average earnings for companies with particularly volatile profit histories. I sorted companies into different growth categories based on sales growth over differing time frames. I used debt to create enterprise value to earnings ratios and adjusted for differing tax and minority interest expenses year to year. I made valuation adjustments for size and earnings variability.
In the end, I ran this fairly complex algorithm through a backtest and examined the results to see if the screening algorithm showed any success in picking subsequent winners.
Nope.
My fantasy of just pushing a button on the computer and having it tell me what stocks to buy looks like it will remain a pipedream for the time being.
I had to go through the motions and see the results for myself, but I understand why this might be the case. If I had a starting list of a hundred stocks, phase one of my screening process might winnow this down to 10 or so companies that look like they could be promising investments based on a purely “by the numbers” analysis. This is the part of the process that a very well designed algorithm, provided accurate enough data, might be able to help with.
But the real meat of the process, the value-add part where I think I really earn my room and board, is the second step of the process where I work though that list of 10 short-listed possibilities to come up with the one that actually ticks all the right boxes. This is the part of the process where I abandon my fancy excel spreadsheet and sit down with a cup of coffee and a copy of the latest annual report and start reading at page 1. Out of those 10 stocks that initially appear to be undervalued, 9 of them will typically fall by the wayside. Maybe there is a class action lawsuit hanging over the company. Maybe they are too reliant on a single customer or supplier (ahem, FL). Maybe there has been a recent change in their industry. Maybe their results have been skewed by government stimulus payments or the sale of a division or the reversal of previous restructuring costs. Maybe the company is moving in a bold but uncertain new direction. Maybe they are at the crest of a temporary fad. Maybe they’ve just taken on a big whack of debt or done an ill-considered acquisition. Maybe there are a bunch of warrants outstanding that dilute the picture. Maybe inventory levels have become too bloated. Maybe there are massive pension liabilities hiding out in the fine print at the end of their financial statements. Maybe the CEO has a past history of financial impropriety. And so on and so on. These are things you can’t program into a spreadsheet. And in large part, they are what separate the winners from the losers.
So with my new spreadsheet at my side I will soon dive into a fresh set of year end results. But in the end, it is still good old fashioned human ingenuity that will make the final call.
Good Intentions
I made a New Year’s resolution of sorts to try to keep these blog posts more concise and to the point. How are everyone else’s New Year’s resolutions working out?
Full Disclosure: I own shares in Foot Locker and Linamar. I do not own shares in Essential Energy Services or Enerflex.