No longer convinced that the next recession is just around the corner, I sold off all of the put options I was using to protect the portfolio and am now operating without a safety net.
A Stay Of Execution?
I just wrapped up my review of the market’s year end earnings results. It was a decidedly mixed bag. Very consistent with what you’d expect to see leading up to your typical recession, in fact. There were quite a few companies, especially those in cyclical industries like auto parts, semiconductors and the “consumer discretionary” sector that saw their profits start to slide at the end of the year. Furthermore, their outlook for the first quarter was not any better and in a number of cases, significantly worse. The retail sector, especially, seems to be looking at a pretty grim start to the year.
This is what the market was telegraphing in November and December of last year when the S&P 500 plunged 20% from the peak it hit in September. At that point, the portfolio insurance I had bought (in the form of put options on the S&P 500) were performing beautifully and it looked like the long wait for the next recession and resulting market rout was finally over.
Then a funny thing happened. The market hit bottom in the last week of December and started going back up. At first, I assumed this was merely one of the many bear market rallies that you’d expect to see on your trip to the ultimate bottom. The unemployment rate seemed to have bottomed out and the yield curve was very close to being inverted, both of which are often signs of an impending recession. I decided to get even more aggressive with my negative positioning and bought yet more put options for the portfolio. The plan was to not just avoid losing money in the coming market collapse but to actually make money from the market’s misery.
Things didn’t quite go according to plan. The market kept climbing and in January, shortly after I had bought the new puts, central banks around the world panicked and started to flood the system with money again. China was especially profligate and dumped a massive dose of stimulus into their economy. (They’ve recently admitted that they went a little overboard and are trying to scale back on their credit boosting activities.) Subsequently, the US federal reserve completely and utterly capitulated to market concerns. After raising interest rates and tightening up their balance sheet for most of 2018, they made a 180 degree turn in policy and became very dovish again. They put their rate hikes on hold while promising to end their campaign of balance sheet tightening. The European and Japanese central banks are doing their part to keep the good times rolling as well.
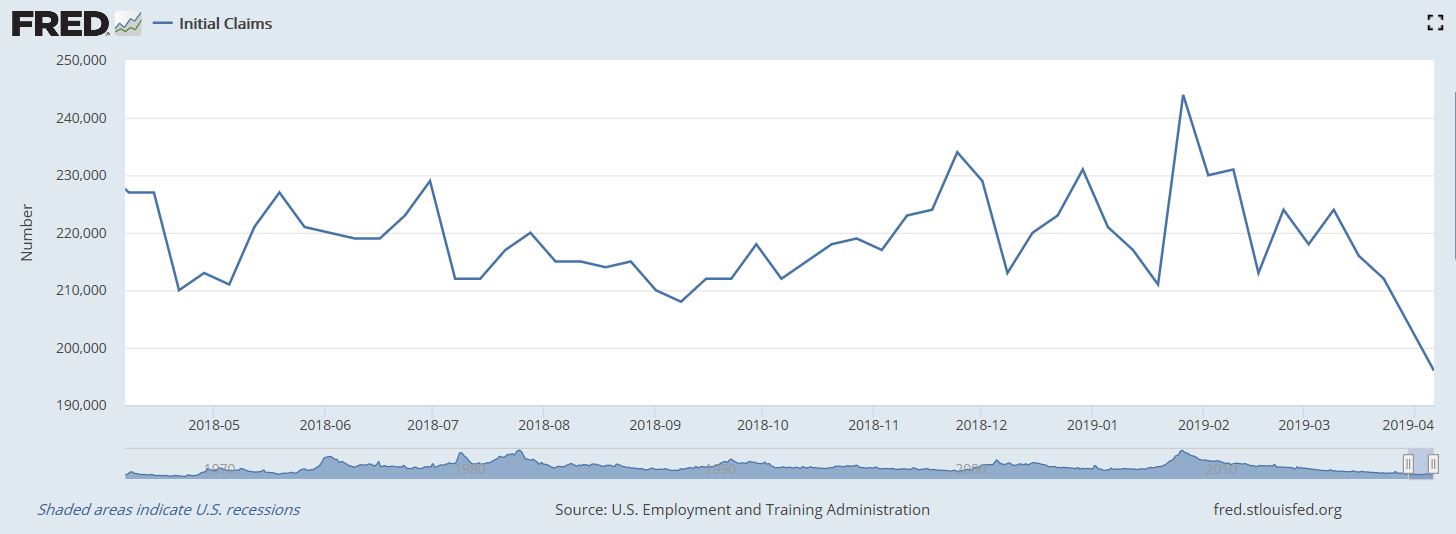
With the central banks of the world apparently hell-bent on keeping this aging bull market aloft, aggressively betting against them being able to do so is perhaps not the best idea. What’s more, it is beginning to look like the economic slowdown that we’ve witnessed over the past few months may not mark the beginning of a full-blown recession. Before this aging business cycle finally sputters to an end, there may be a few more quarters (a few years even!) of continued vigour. There seem to be some green shoots on the horizon. Crucially, China’s manufacturing index, after bottoming out below the 50 level that indicates contraction, has moved back into expansion territory. As well, the most recent reading on initial jobless claims seems to be sending a signal that the unemployment rate could be headed even lower in the months to come.
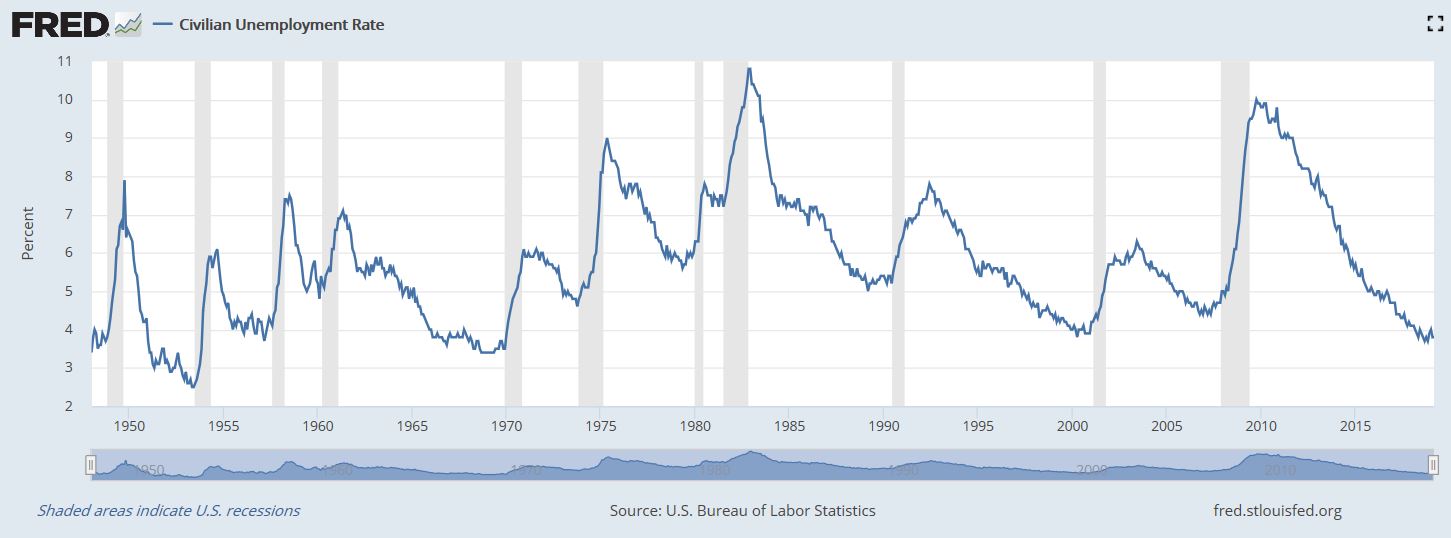
If we look far enough back in history, we can see some precedent for a prolonged period of low unemployment. The unemployment rate spent several years at the bottom during the late 60’s and late 80’s before a recession finally kicked in and sent rates back up. Perhaps we’ll see a similar prolonged period of record low unemployment this time as well, along with a business cycle that may keep going for a year or two longer. It’s been a long, slow recovery from the last recession and this could mean that the usual late cycle excesses haven’t had a chance to build up quite yet to the levels needed to spark the next downturn.
Most importantly though, the market itself is sending a very strong message. It is never a good idea to ignore what the market is telling us and with stock prices once again flirting with all time highs, the market is telling us that the slowdown at the end of last year and the beginning of this one was temporary and that better times are ahead.
This kind of mid or late cycle slowdown is certainly not unprecedented. We only have to go back to 2015/2016 to see a similar pattern playing out. I was hedged then as well, expecting the slowdown to turn into something worse. And back then, I sheepishly sold off my hedges in early 2016 when it appeared that the economy was not ready to roll over and play dead quite yet.
The tricky aspect of using put options to protect your portfolio from disaster is that they come with a best before date. You can be right about the ultimate direction of the market but you also have to be right about the timing. Being right too late is the same thing as being wrong. The put options I owned were due to expire in December of this year. With the recent strength in the market, the dramatic dovish turn in central bank policy and the signs of some emerging strength in the Chinese economy, I no longer have as much conviction that we’ll see the downturn begin in earnest before the end of the year. If a downturn does not materialise before year’s end, my put options would expire worthless. I’d rather take this money off the table now when I can still get a decent chunk of it back.
However, this leaves me fully exposed to the market. I am now operating without a safety net and that is a scary proposition with valuations (average p:e ratios, p:b ratios, market cap/gdp ratios, etc.) all sitting near record highs. The market is vulnerable. Worst case scenario, if the market were to abruptly tumble all the way from record high valuation levels to record low levels as happened from 1929 to 1932, we could see stock prices fall by 2/3 or more from where they are now. But this is just one scenario out of many. A long, prolonged sideways drift or a gradual 2 steps down / 1 step up decline that extends over many years is also a distinct possibility. Put options don’t do you that much good in these latter two scenarios. They really only pay their way in the sudden, dramatic blow-out scenario; the kind we witnessed in 1929 or 2008. In a less melodramatic scenario, staying fully invested, especially if you think you have the stock picking skill to generate alpha on the way down, might be the better approach.
Insurance is expensive. Put options act like a form of portfolio insurance and you pay for the peace of mind they give you. I started buying put options back in November of 2017. In retrospect, this was fairly decent timing. The market spiked to a record high a couple of months later but then spent the next year lurching up and down. When it was down, the puts showed their worth but when it was up, they were a drag on performance. Below is a graph of my portfolio’s performance since November 2017 both with and without the contribution (or more typically, drag) from the put options.
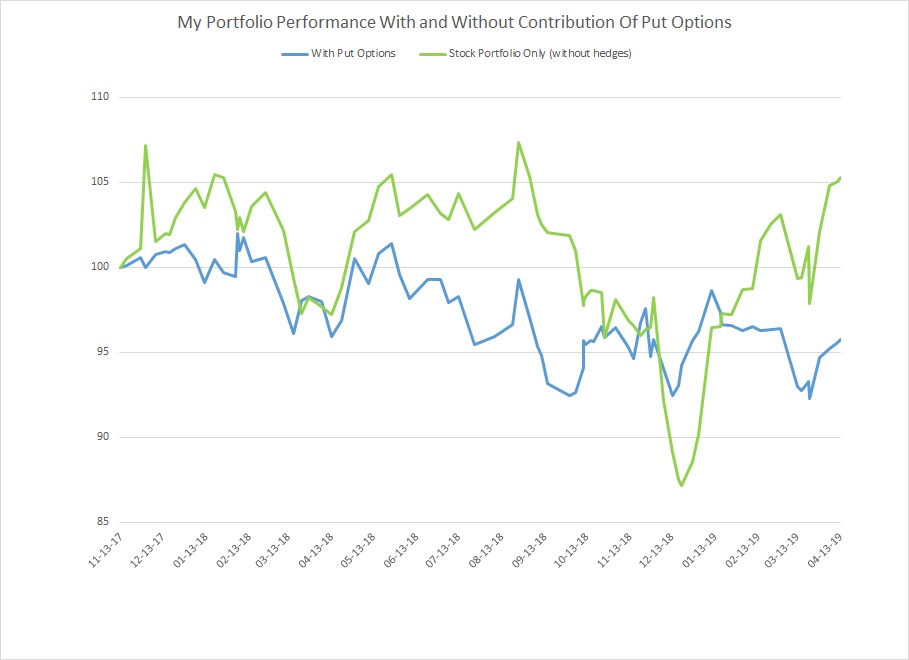
During the time I owned the put options, my stock portfolio managed to gain a modest 5%. However, once you factored in the drag from owning the put options, that 5% gain turned into a 4% loss for the portfolio as a whole. The put option insurance ended up costing me about 9%. Was it worth it? Hard call. It certainly would have been worth it if markets had crashed. But they didn’t.
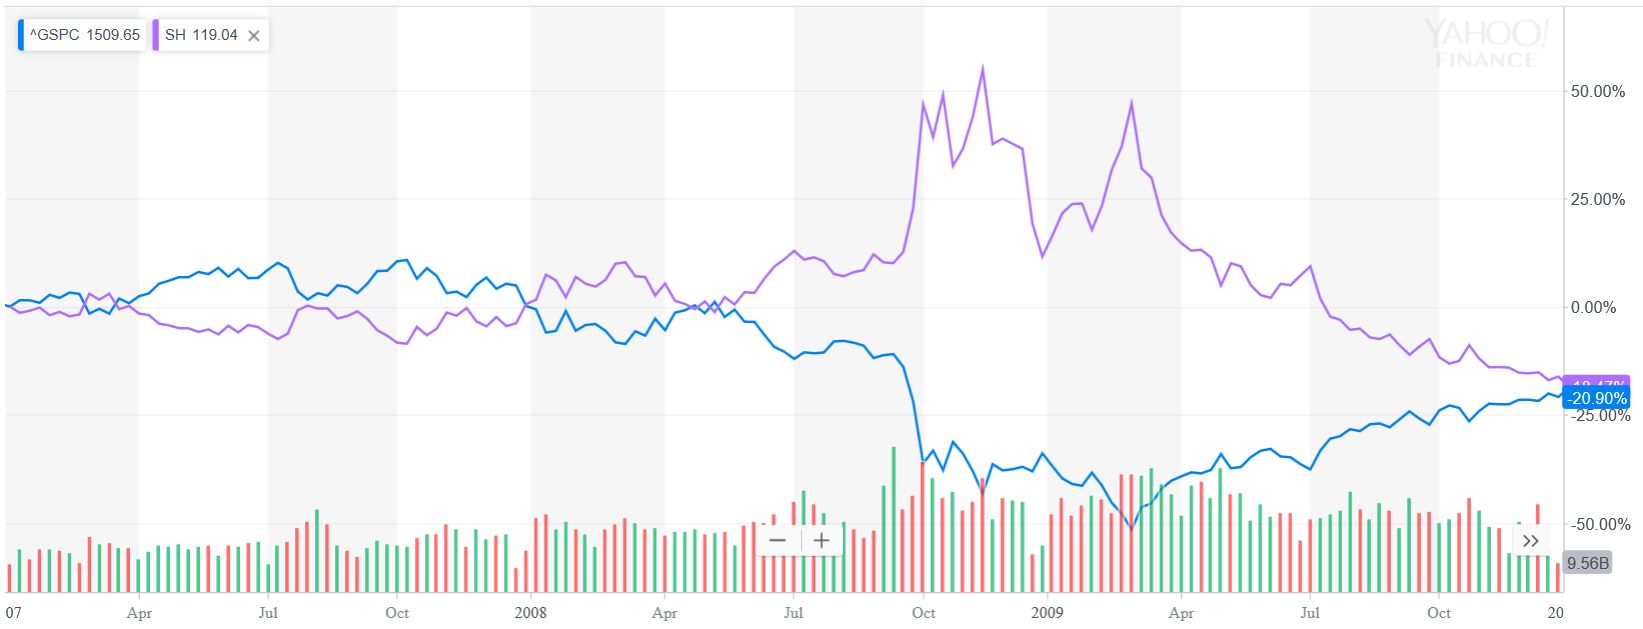
The various hedging strategies that are available to investors tend to all be fairly expensive. Put options have an expiry date and frequently, they end up expiring worthless. With short selling, you have to pay interest on the shares you borrow to short. The most attractive shorting opportunities often come with the highest interest payments. Inverse ETF’s like the ProShares Short S&P 500 can act unpredictably just when you need them the most.
Finally, there’s good old cash (or “safe” government bonds). Cash in the pocket is never a bad thing. Except that it earns you nothing. A significant holding in cash comes with its own significant opportunity cost.
With the sale of my puts, I’m psychologically “all in” once again. I’m not too thrilled about that. I do not have faith in this market. I think not just stocks but all manner of financial assets will be a big disappointment to investors over the coming years. But I can’t say for sure that the end is nigh. My put strategy only works in an immediate, sharp market sell-off. I’m not sure that’s what we’re in for. A good friend of mine is predicting what he calls “the long slump”. In a long slump scenario, a good offense may be your best defense.
For the moment, I will concentrate on finding the best companies at the cheapest prices and hope that this serves me well over the long run. I may revisit my put options at some point in the future, if economic indicators flash a sufficient enough warning. But for now, I’m operating without a safety net.
Full Disclosure: I do not own any SPY or SPX Put Options.