Hibbett Sports makes a return appearance and replaces Designer Brands in the portfolio. I also introduce the 5 year P:E ratio for the first time and use this tool to evaluate my current portfolio holdings.
The State Of The Market
The weather outside is turning cooler and the leaves are starting to turn. A thick layer of fog hangs over the river most mornings before being burned off by the warming rays of the sun. The kids are back in school and another hectic summer has drawn to a close. Time to dust off the spreadsheets and see what new surprises the market has in store.
I just put the finishing touches on a review of second quarter results. The wind-down from the covid frenzy continues but it is slow and sporadic. Surprisingly, many companies are still riding high, enjoying record profits and profit margins. But cracks are appearing. A few companies have already fully given back their covid-era windfall profits and their stock prices have retreated accordingly. Others are only just now showing the first signs of weakness. Still others seem to be doing well, on the surface, but have issued more sobering guidance for the upcoming quarters.
I was looking at a graph of the year over year change in United States GDP recently and I thought it perfectly illustrated just how extreme the distortions of the last few years have been.
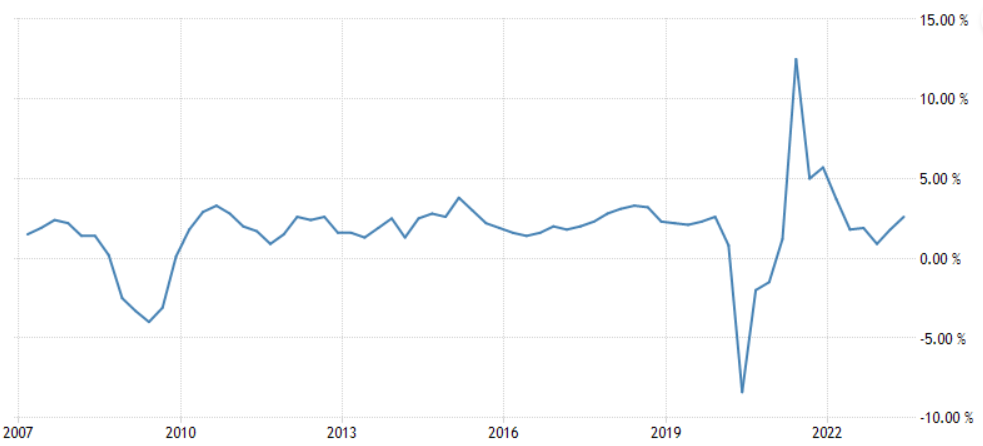
First we had a downturn to rival the Great Financial Crisis of 2008, but that was followed in short order by an incredible boom the likes of which I personally had never seen.
While you might conclude from looking at this graph that it is finally back to business as usual, that’s not the sense I was getting when I was surveying the market over the past couple of weeks. The air is indeed being let out of the balloon, but it is being let out slowly and sporadically. Corporate profits are still high and there are a dearth of good bargains to be had. Perhaps the refusal of this market to die a quick death has something to do with the $14 trillion in fiscal and monetary stimulus the US government has thrown at it. (Not to mention the additional trillions that other world governments have added to the pot.)
I still find myself playing a defensive game. I’m being cautious and sticking with companies that have a longer-term track record and which do not seem expensive even when I pencil in a return to pre covid levels of profitability. Doing this rules out a lot of companies that look cheap when only looked at through the shorter-term lens of the last few years.
Which means that my search for new opportunities to fill up the portfolio was largely unsuccessful. I suspect it will take another few quarters for the covid era excesses to fully work their way out of the system. Maybe then I can broaden the portfolio out a bit more.
Dance of the Shoe Retailers
In the meantime, the one new idea that I did uncover was actually an old portfolio alumnus. Hibbett Sports, a US based retailer of footwear and sporting apparel, has wormed its way back into the portfolio after taking a 3 year sojourn. It displaces Designer Brands, another shoe retailer which recently bumped up on stronger than expected second quarter results. (Not a hard bar to hit as expectations were extremely low to begin with.)
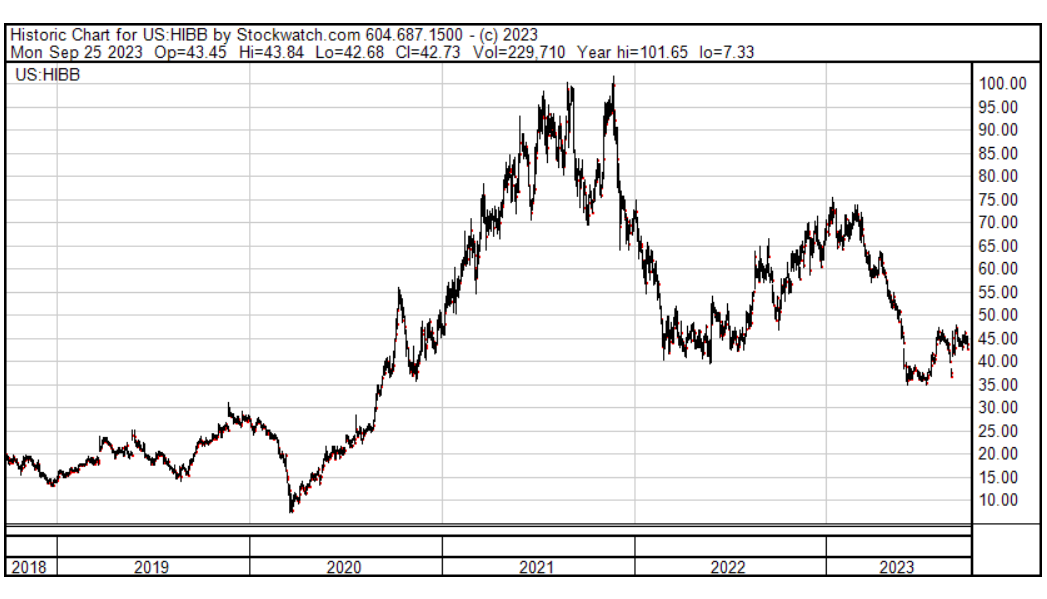
This is just the latest step in my ongoing dance of the shoe retailers. It all started with Hibbett back in September of 2019, when the word coronavirus simply referred to a class of mildly annoying cold viruses. I rode the stock through the worst of the initial covid shutdown and then sold it a few months later with some relief as the stock not only fully recovered from the initial panic but went on to hit new highs. I had doubled my money from my initial purchase price but in retrospect, sold waaaay too early as the retail sector went bananas and Hibbett’s profits exploded higher. I had bought at $16 and sold at $33. Before all was said and done, the stock would briefly top the $100 mark.
But not to fear. I quickly pirouetted from Hibbett into Genesco, another shoe retailer which I thought offered better value at the time. Genesco went on to triple in price by the time I sold it a year later. In the meantime, I had added Foot Locker to the portfolio. This was not one of my better dance moves. An unexpected pull-out by their biggest customer, NIKE, threw me off balance. I managed to recover my poise and skipped away with a more modest 22% gain.
Next up on the docket was Designer Brands, owner of the Designer Shoe Warehouse franchise. I had high hopes for this one, but my initial ardour began to cool as debt levels climbed and earnings deteriorated, not only for DBI but for the retail sector as a whole. A well-executed second quarter got a round of applause from the audience, though, and sent the stock price up 30% over where I had bought it 9 months earlier. Not a bad performance at all, considering the Russell 2000 was exactly flat during this same time period.
Which brings me full circle to my recent sale of Designer Brands at $12 and the re-purchase of Hibbett Sports (HIBB.NASDAQ) at $45, moderately above where I had sold it 3 years earlier.
Dance Moves
So why the change in dance partners? Designer Brands still looks undervalued. Indeed, many of the publicly traded shoe retailers (Hibbett, Designer Brands, Foot Locker, Genesco, Shoe Carnival, Caleres) look undervalued at the moment. But comparing Hibbett to Designer Brands, I think Hibbett is cheaper, has a much stronger balance sheet and arguably better growth prospects going forward.
Prior to covid these two companies were on a very similar trajectory. Both had enjoyed market beating growth in sales over the preceding 7 years. Both had similar profit margins. Both saw those profit margins crumble during the retail apocalypse, falling in the 3 years before covid by half from their previous highs. However, here the story diverges. DBI was hit harder during the early days of covid, recording a large loss in fiscal 2021 which took a big bite out of their book value, sending it down by 20% from pre covid levels. Profits did recover subsequently, and they enjoyed some modestly successful years in 2022 and 2023 but then things deteriorated again as retailers worked through their excess inventory and customers took their discretionary dollars elsewhere. Forecasted earnings this year are now back to immediate pre covid levels. Sales growth over the last 4 years has been meagre and has not kept pace with inflation. All of this has taken a toll on the balance sheet and debt is starting to look uncomfortably high at 4.5x projected earnings.
By contrast, Hibbett was able to lean into the covid era boom. They never recorded an annual loss in the early days of covid and went on to post two absolutely blockbuster years of earnings with windfall profits of 4-5x pre covid levels. These profits got recycled back into book value which has climbed by 64% over the past 4 years. They also bought back a whackload of shares (one whackload = 4.1 million shares) which will help keep earnings per share higher as we move forward. As would be expected with these sorts of results, the balance sheet looks very healthy with debt less than 1x earnings.
The bloom is starting to come off the rose as the recreational/fitness/outdoors boom of the last few years slowly fades. Profits at Hibbett are coming back down to earth and the stock price is coming down along with them. My belief is that investors are over extrapolating this negative trend, just as they got carried away on the upside.
The company is guiding for EPS of $7.00 this year which would give the stock a p:e of 6. That is quite attractive. By comparison, DBI is guiding for EPS of $1.35 at the midpoint, for a p:e of 9. In both cases, I think these are reasonable numbers to use for baseline earnings moving forward. Both of these are guesses only. The future could be better or worse than that for either company. But Hibbett offers other advantages. It’s balance sheet is much stronger, with a minimal amount of debt. It is coming out of covid in very robust shape whereas Designer Brands is a bit battered and bruised by the whole experience.
Hibbett is also actively expanding. They have 1148 stores in 36 states and have plans to open 40 to 50 new stores a year. They recently entered the Las Vegas and Milwaukee markets, for example. Most of their stores are in strip malls, insulating them from the drama that is going down in the big, enclosed shopping mall venues. As well, they acquired an urban brand, City Gear, a few years ago and have apparently done well with this, which hopefully bodes well for possible future acquisition activity.
On the whole, I think there is enough to tilt the scales in Hibbett’s favour to justify doing the shoe store two-step at least one more time.
A Sideways Bear
The past 5 years have not been kind to small cap investors. The Russell 2000 index of small cap stocks is actually down about 9% from where it was 5 years ago, once you adjust for the ravages of inflation. Over the same time period, and on the same inflation adjusted basis, my portfolio is up 98%. I must be doing something right. But in the heat of the moment, it doesn’t always feel that way. You do your analysis. You make your decisions. Sometimes those decisions feel uncomfortably like guesses. Some of them work out. Some don’t. But when the dust settles, you find you’ve made a pretty decent amount of money. The past 5 years have been a real testing ground. In an incredibly challenging environment, a concentrated, no-holds-barred, deep value investing approach has proven itself yet again. It’s even managed to outperform the Nasdaq Composite Index, by a ratio of more than 2 to 1 and the S&P 500, by a ratio of 3 to 1.
| 5 Year Cumulative Performance, Adjusted For Inflation | |
| My Stock Portfolio: | 98% |
| Russell 2000 Index: | -9% |
| Nasdaq Composite Index: | 42% |
| S&P 500 Index: | 27% |
Introducing the 5 Year P:E
My wife has been expressing some interest lately in learning how exactly I go about managing our portfolio and choosing the investments that I do. It probably has something to do with our weekly spinning sessions and the alacrity with which I throw myself at the spin bike. The instructor makes me sit at the back because he says I’m too distracting, and my wife says she’s always worried I’m going to have a heart attack.
I’ve tried fobbing her off with the indexing platitude. Just put half your money in some sort of one year interest bearing vehicle. (In Canada, we call them GICs.) And put the other half into an ultra-low cost S&P 500 index fund or ETF. Rebalance yearly. Even in pretty dire circumstances, a portfolio like that should let her take out 3-4% a year in relative safety.
Those are the fallback instructions. But she wants to learn more. She’s listened to me as I’ve derided the overpriced hype stocks that tend to make up a disproportionate percentage of the indexes, especially near market tops, and she doesn’t relish loading up her portfolio with that kind of overpriced baggage. She wants the kind of sensible, low-priced, unexciting but potentially far more lucrative stocks that I tend to favour.
I launched this website 5 years ago with this exact scenario in mind. I had the vague hope that someday one of my family members might actually take a serious interest in what I was doing. I wanted there to be a record of what I had done and how I had done it, in case my kids, grandkids, spouse or anyone else who might stumble across these pages ever wanted to follow in my footsteps.
To that end, I wrote the series of articles in the Value Investing 101 section of this blog. I’ve recently gone back and edited and re-written some of the articles in this section. Specifically, the “Building a Valuation Framework” and “Hitting The Books” sections have gotten an extensive overhaul.
Thinking about how I could present my valuation approach in a more clear and concise manner, I came up with the idea of the 5 year P:E ratio. For the more casual investor, and for anyone really, I think this could be a very good way of framing the valuation process.
The value of a company essentially rests on two basic assumptions. You need to come up with an idea of what the baseline earnings are for the company you’re looking at and you need to form an opinion as to how quickly those earnings might or might not grow in the future. You can use those two pieces of information in a variety of ways to give you a reading on what the value of the company you’re looking at is.
The 5 year p:e is an easy way to combine these two pieces of information into one easily understandable and comparable metric. You start with your best guess as to what a representative earnings number might be for the company in question. You then extrapolate those earnings 5 years into the future using the growth rate assumptions you’ve come up with and you calculate the p:e by dividing the current share price by what you think the company will be making 5 years down the road.
You do this for as many companies as you have time to analyse and then you focus in on the ones that are trading at the lowest 5 year p:e ratios.
In my recent stock review, I did precisely that. I went through a list of 400 or so small cap stocks. I ignored the companies in sectors that I wasn’t interested in, like banks and mining companies and I excluded any companies that were carrying excessive amounts of debt. For each company, I made my usual earnings and growth rate estimates and then I combined these into a single 5 year p:e number.
Here’s what the results of that survey looked like. The graph below shows the number of companies in the list, as a percent of the total, that fell into each p:e bucket.
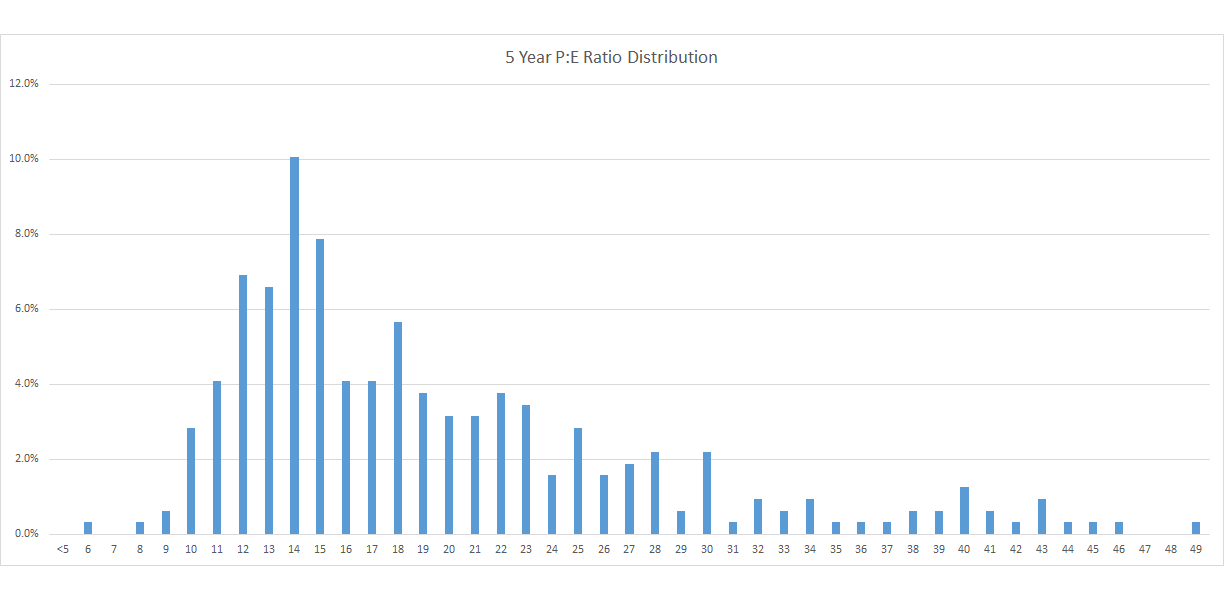
As you can see, small cap stocks are currently clustering around a 5 year p:e ratio of 14. That is, they are trading at 14 times what I think they will be making 5 years down the road. There are a handful that sport lower p:e ratios and these are the ones that I went back and looked at in greater detail, and there are quite a few that skew higher. In many cases, the stocks with the high 5 year p:e ratios have company reported earnings that are well above my own estimates. Another investor, taking the company’s current earnings at face value, might arrive at a p:e ratio that wasn’t particularly high. But my own earnings assessments, given how skeptical I am that current record profit margins are sustainable, tend to be lower than the consensus, and thus my own calculated p:e ratio tends to be higher.
Alternately, the market may be assuming a higher future growth rate than I am. I’m often just as skeptical that high growth will continue as I am that high profit margins will be sustainable. On the flip side of the coin, the companies that are huddling down below the average 5 year p:e line are there because the market’s assessment is bleaker than mine. Companies like Sylvamo, Hibbett and Linamar find themselves here because other investors have made earnings assumptions that are less generous than mine. Often, they will take recent negative trends and extrapolate them too far into the future.
Value investing is about finding the situations where your assessment diverges significantly from the consensus. The 5 year p:e ratio helps you get there. Again, you can read more about this and the other techniques I use to zero in on undervalued stocks in the Value Investing 101 section of this website.
The 5 Year P:E In Practice
The table below shows how the 5 year p:e numbers break down for my current portfolio holdings. The baseline earnings estimate is the amount I think a company can earn during a typical, non-recessionary year, once the distorting effects of the pandemic have finally worked their way out of the system. The growth rate is my very rough estimate of how quickly I think those earnings might grow over the next 5 years.
Putting these two things together, I can calculate the 5 year p:e using the following formula…
5 Year P:E = Current Share Price / (Current EPS x (1 + growth rate) ^ 5)
As I detail in my “Building a Valuation Framework” article, I don’t get too fussed about trying to narrow growth rates down to the nearest percentage point. 0% (no growth), 5% (average growth), 10% (compounder) and 15% (high growth) is usually about as fine as I’ll bother to cut it.
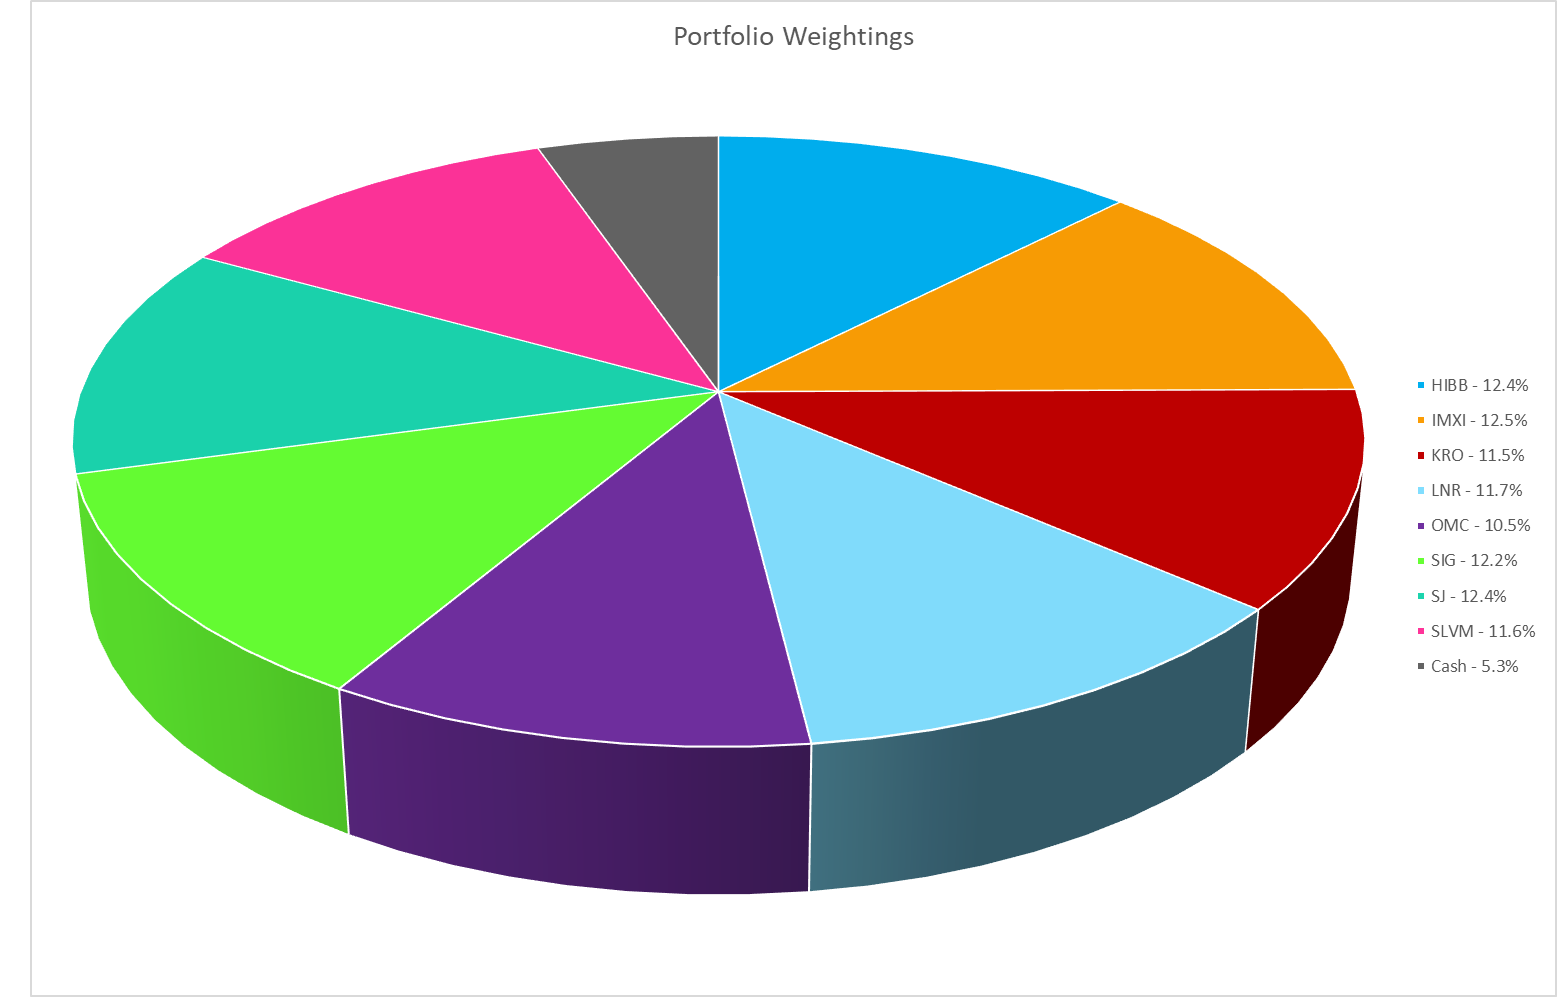
| Baseline Earnings | Growth Rate | 5 Year P:E | |
| HIBB | $7.00 | 5% | 4.8 |
| IMXI | $1.63 | 5% | 8.1 |
| KRO | $0.57 | 5% | 11.2 |
| LNR | $7.77 | 0% | 8.4 |
| OMC | $7.00 | 0% | 10.6 |
| SIG | $7.00 | 5% | 8.1 |
| SJ | $4.46 | 5% | 11.1 |
| SLVM | $6.00 | 0% | 7.3 |
| Target 5 Year P:E Ratio: | 14.0 | ||
All of these stocks are sitting quite comfortably below the average 5 year p:e of 14. Which of course is why I have them in the portfolio. Some of them have a lower p:e ratio than others but I don’t slavishly stick to this ranking. A small tweak in my estimates for either earnings or growth could easily cause any two stocks in my portfolio to switch places, which is why I don’t usually play favourites and I often keep roughly equal amounts of money in each holding, rebalancing periodically.
Portfolio Review
Unsurprisingly, Hibbett makes it to the top of the list with the lowest 5 year p:e ratio. After all, I just bought it, so I must think it offers compelling value. Management is guiding for EPS of $7.00 to $7.75 this year and I’ve used the low end of that range as my baseline earnings number. If I were to put an average growth rate of 5% on that, I’d come up with a 5 year p:e of only 4.8. Yowza. If those numbers prove accurate then a 2 or even 3 bagger from current levels is well within the realm of reason.
It’s possible that management is overplaying their hand. But even if I put on my skeptics hat and pencil in a retracement in both sales and profit margins back to their pre-covid, retail apocalypse levels, I get an earnings number of $4.00 (using the shiny new reduced share count) and a 5 year p:e of 8.4, still quite reasonable. Watch the market prove me wrong, but I’m struggling to see much downside here.
I also quite like International Money Express. I bought this stock a year ago, for slightly more than what it’s trading at now. In the meantime, the picture has only gotten more attractive. They’ve been growing their sales and earnings at a rapid pace and I think the future looks quite bright. The company operates through a network of agents offering money transfer services to the Hispanic immigrant community. Say what you will about the wave of immigration along the southern US border, but all those immigrants are potential Money Express customers. The company is actively expanding its network of operators, and recently made an acquisition that has given them an entry into the European market. This is a company growing at a well above average rate that is selling for a p:e that is well below the market average. The market has been ignoring the company because of worries over disruptive new money transfer technology. And maybe someday those worries will prove justified. But right now, that’s not the sandbox this company is playing in. It seems to be doing just fine with its old school network of convenience store operators and its reputation for quick, reliable, cash-based payments.
I’ve put in an average growth rate assumption into the 5 year p:e table above but if I was to be more generous and pencil in a 10 or even 15% growth rate, the 5 year p:e would look even more attractive. A 10% growth rate, which is completely within reason, given the company’s performance over the last few years and its well-defined plans for future expansion, would give it a 5 year p:e ratio of only 6.4.
Sylvamo and Kronos are my two back door commodity plays. I generally don’t like investing in mining exploration or production companies, but with the possibility of a secular shift towards a higher inflation rate environment, having some exposure to hard assets is appealing. Sylvamo and Kronos give me some of that exposure.
Sylvamo is a paper manufacturer with operations in Europe, North America and Brazil. It is vertically integrated to a large extent, harvesting its own timber and turning it into pulp, which it then uses to make paper. It uses off-cuts from these operations to help heat its factories, thus saving on energy costs. It is one of the lower cost producers of paper globally, which is essential because this is a dying industry. Sylvamo is in a race against time as the demand for physical paper steadily erodes. Its goal is to be one of the last men standing, rewarding shareholders with a steady stream of cash as it guides its business into a slowly declining glidepath.
This is going to be a tricky feat to accomplish. I bought in at a very low p:e, but since then, earnings have deteriorated more than I expected. I am betting that this is a temporary slowdown and that earnings will recover at some point. During its more productive years in 2018, 2019, 2021 and 2022 the company made $7.50 or more per share. In 2020, when demand was curtailed by the initial covid lockdown, earnings fell down to the $3 mark and this year as weak demand from a slowing economy and a glut of pulp sends both pulp and paper prices downwards, the company is on track to earn only $6.
I hope I am erring on the side of caution in using $6 as my baseline earnings estimate. I’m also assuming no growth going forward. Using these assumptions still gives me a reassuringly low 5 year p:e ratio. If the latest weakness in earnings proves transitory and earnings recover back to the $7.50 mark, then the picture looks even better. If instead, the recent slump in paper demand proves more long-lasting, then a further decline in earnings to the $4 mark is possible. In which case the 5 year p:e would rise to 11. Still undervalued when compared to the market average, but less so.
Kronos is another commodity play. I bought this stock in the Spring at a low p:e to peak earnings, fully expecting a few quarters of red ink before an eventual recovery. And so far, that is what I have got. The company makes titanium dioxide, a whitening pigment used in a wide variety of consumer goods. With retailers furiously de-stocking their bloated inventory it is no surprise that demand for TiO2 is in the dumps. The company is losing money now so I am resorting to the rule of thumb that I often use for these turnaround situations. I’m using past earnings from before the downturn and then applying an arbitrary 25% haircut to those earnings to reflect the uncertainty of a full recovery.
We’ve had 3 quarters of losses now and the stock price is languishing around the $8 mark. I’m willing to wait a few more quarters to see if the cycle will turn, as it has in the past, because a recovery to previous earnings levels of 76 ¢ would give the stock a 5 year p:e of 8.4 and mean a potential 2 bagger from the current share price.
I’ve owned Linamar longer than I’ve owned any other company. I first bought this stock back in 2016. Since then, earnings have flat-lined as the company and the auto sector in general have dealt with a number of challenges, not least of which is the transition to an electrified future. A massive shortage of chips during the covid years also wreaked havoc on the industry.
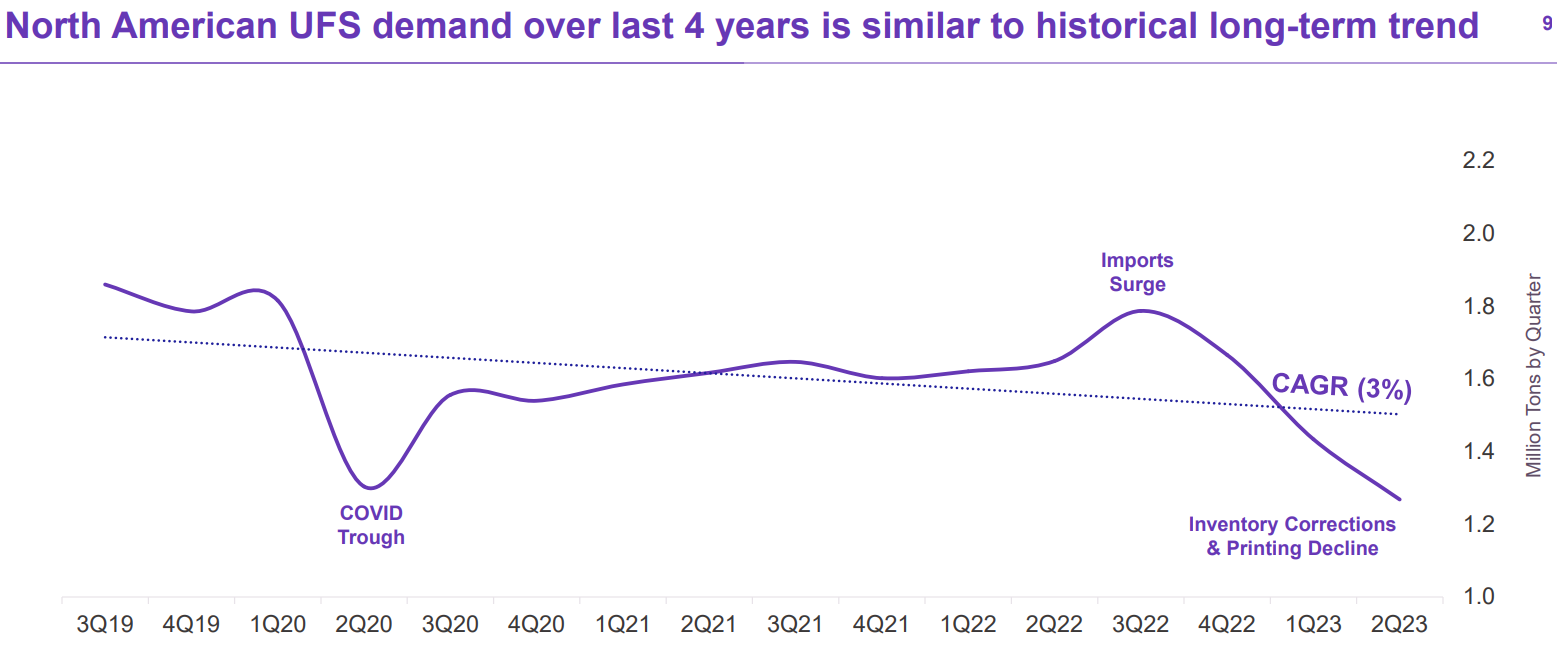
This chart of domestic auto industry inventories paints an illuminating picture…
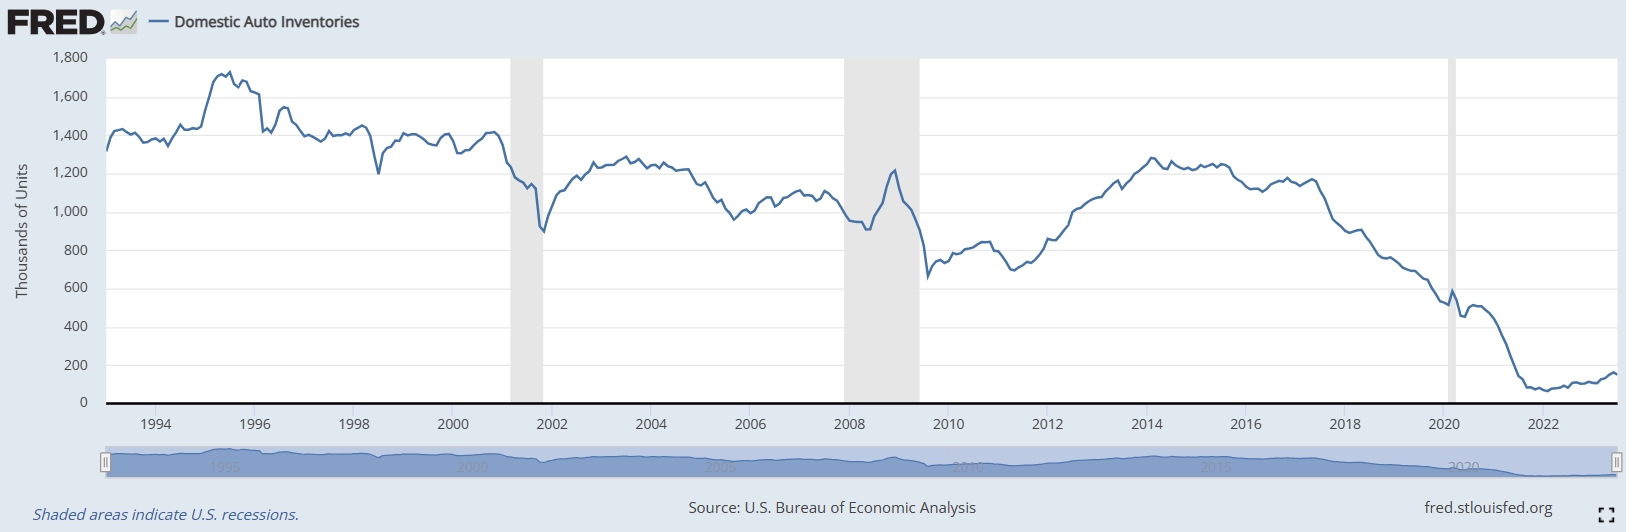
Auto inventories have now fallen to record lows. It doesn’t seem like there is really much further they can fall. If they end up recovering some of that lost ground, that could provide a nice tailwind of pent up business for auto parts makers like Linamar. Linamar continues to look attractive based on its trailing earnings even using an assumption of zero growth over the next 5 years. But I remain hopeful that both those earnings and growth rate assumptions will prove to be overly conservative.
Linamar has not been idle the past 7 years. They have made dramatic changes to their business and I believe are very well positioned now to ride the upcoming wave of electrification. They have transitioned their automotive segment from an almost 100% reliance on the internal combustion engine to a near 60% exposure to electric or “propulsion agnostic” business. They have been signing reams of new contracts in the EV space and as these programs ramp up over the next few years this should be highly accretive to profits. What’s more, they have diversified away from autos in general and in the most recent quarter, well over half of their profits came from their industrial and agricultural equipment divisions.
The company has paid down most of its debt and has the firepower now to do another major acquisition if the right opportunity presents itself. The current United Auto Workers Strike might well present just such an opportunity. I’ve used the recent share price weakness caused by this strike to add to my position in Linamar.
Omnicom Group has become my play on artificial intelligence. They have partnered with Microsoft to develop their AI offering and released a flurry of announcements touting their initiatives in this regard. Whether anything will come of this activity remains to be seen. Regardless, Omnicom is one of the world’s leading advertising agencies. The company had a long run of solid performance which ground to a halt about 6 years ago. Since then, they’ve been treading water as they do a series of restructurings and try to deal with the disruptive effects of an advertising industry in transition. They say they have put their restructuring behind them and are ready to move into a new era of growth. I hope so. But the stock looks undervalued even without assuming a resumption of previous growth trends. The 5 year p:e of 10.6 is not the lowest on the list but for a large cap stock, with a clean balance sheet, that is about as low as you’re going to get. If Omnicom can return to an average rate of growth, then the 5 year p:e ratio drops to 8.3 and the stock looks even more attractive.
Signet Jewelers joins Hibbett as one of the two retailers in my portfolio. The retail industry is a scary place to be right now, but Signet seems to be managing well. Profits are coming down from their covid era highs and I am hoping that they won’t retrace all the way back to their pre covid lows, although I can’t be sure that that won’t happen. For what it’s worth, that is not what management is projecting. They think they have made significant structural improvements to the business during covid and these will result in consistently higher profitability. I’ve been dismissive of similar comments at other companies but after reading through all the company literature, I am inclined to give Signet the benefit of the doubt.
I am currently using $7 as my baseline earnings projection for Signet which gives the stock an attractive 5 year p:e ratio of 8.1. The company has been growing its sales both through a series of acquisitions as well as through organic growth. They’ve implemented a number of technological innovations into their operations. They’ve been doing well with the new trend towards lab-grown diamonds which carry higher profit margins than the traditional kind that you dig out of the ground. Covid resulted in a dearth of new engagements and therefore a lull in the demand for diamond jewelry, but they see early indicators that the lull in engagements is reaching an end and they see improvement on this score in the coming quarters.
The company has no debt and cash in the bank with which it could do more acquisitions. If profit margins manage to stick at the current level and even expand as the wedding cycle kicks back into gear, then this stock could do quite well. If instead, we see a retracement all the way back down to pre-covid earnings of $3.50 (which I think is unlikely) then the 5 year p:e rises to 16. Not egregiously expensive, but at that point, the stock would become a sell.
Stella-Jones is a Canadian company that deals in pressure treated lumber, utility poles and railway ties. Their utility pole segment has done particularly well over the past year and they forecast this to continue as utility operators upgrade and improve their electrical grid and as telecom operators continue to roll out new services. This has been a long-term solid performer and while the stock’s p:e ratio is currently one of the highest of any of my holdings, I am not in a rush to sell. Using trailing earnings and a conservative growth rate estimate of 5%, the company still looks to be moderately undervalued. If I was willing to extrapolate the 10% growth rate of the last 10 years 5 more years into the future, I’d end up with a 5 year p:e ratio of 8.8, making the stock that much more attractive.
Playing With Models
As you can see, I like to play around with the assumptions I use to value stocks. I like to consider different scenarios. What if this happens? How would that affect the valuation? What if the opposite holds true? What if growth ends up surprising to the upside? Or the downside? How would this affect my opinion on the value of this company? How would an earnings disappointment affect the outlook? What if earnings beat expectations instead? I don’t let myself get committed to any specific outcome or set of assumptions. I’ve been doing this long enough to know that the future very often turns out differently than I expect it to. But if a stock looks undervalued across a wide variety of different plausible scenarios (and a few implausible ones) then I know I am probably on to something good.
Best Laid Plans
When it comes to scheduling my upcoming investment activities, I often make plans and then I break them. Nonetheless, my current plan is to put the portfolio to bed for a few more months. I’m happy with the review I just did. I gave the market a thorough going over and while I didn’t find much, I’m satisfied that I turned over all the rocks I wanted to turn over. At the very least, I’m satisfied that the stocks I currently own are among the cheapest on the market. Another quarter will bring another set of results and another chance to find new opportunities. My plan is to do my next review towards the end of January and I’ll blog about my exploits when I’m done.
In the meantime, if I stumble across anything interesting or if I can think of anything else intelligent to say I’ll blog about it. If not, have a wonderful fall.
Full Disclosure: I own shares in HIbbett Sports, International Money Express, Kronos Worldwide, Linamar, Omnicom Group, Signet Jewelers, Stella-Jones and Sylvamo. I do not own shares in Designer Brands Inc..