Sold on its merits, I add Omnicom to the fold.
Omnicom Group – OMC.NYSE
November 2, 2020
Share Price: $47.20
Number Of Shares: 214 973 000
Market Cap: $10.1 billion
Playing In The Big Leagues
Last week I was lying on my couch with my laptop and a bit of time to kill and I idly decided to run a screen of the S&P 500, to get a lay of the land and see if perhaps there might be some value lurking within the more heavily trafficked corners of Wall Street. Right now, my portfolio is heavily overweighted towards deep value, turnaround type companies. Understandable given where we are in the economic cycle. Best to buy when others are fearful, right? Still, I wouldn’t mind having a bit more stability in there to balance out the fairly aggressive tilt of the portfolio, especially as negative news headlines continue to pile up on an almost daily basis. What better place to look for stability than the venerable S&P 500?
At first, what I found was not particularly reassuring. I ranked the S&P 500 companies by their price to earnings ratio using last year’s earnings. (Earnings this year being all over the map.) The median price earnings ratio clocked in at 26.5. Ouch. That’s nosebleed territory folks. We’re talking 1929, the internet bubble and this. Looking at the top end of the list, things get even stranger. 26 companies were sporting p:e ratios over 100.
Ignoring this inconvenient truth, I cast my eye towards the bottom of the list. Here, prices seemed a little more sane, but the list was mostly populated by the usual suspects: oil and gas, travel and hospitality, financials. I wasn’t looking for another turnaround play. I was looking for something that I could more comfortably weather this storm with.
Omnicom Group
Close to the bottom of the list was a company called Omnicom Group that hadn’t crossed my radar before. Intrigued, I fired up the numbers. (I subscribe to a website called GuruFocus which offers a bevy of financial data that you can download into an excel spreadsheet and play around with to your heart’s content.)
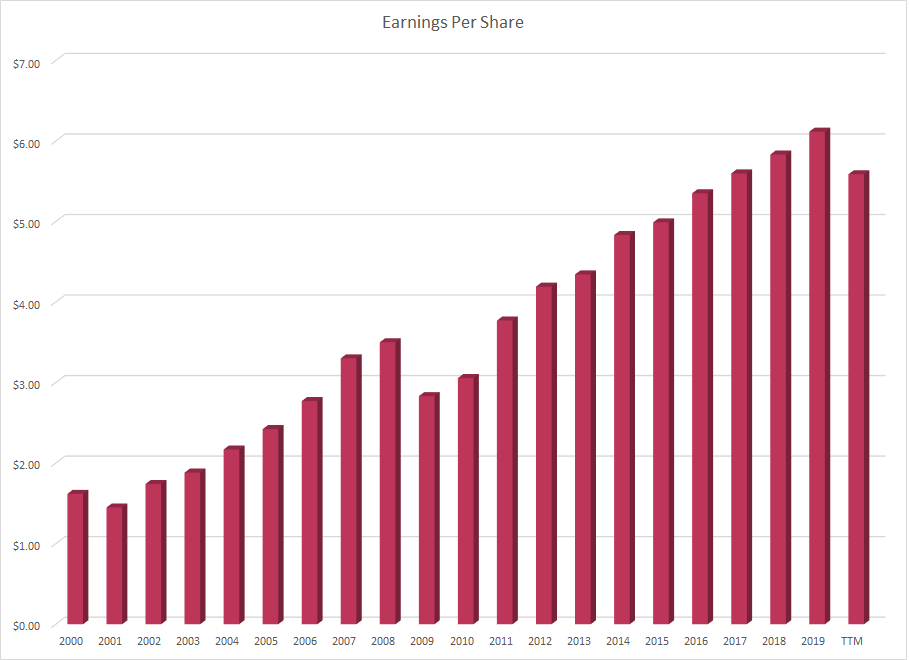
Here are what the numbers looked like for Omnicom…
(Sales and earnings are per share. Earnings are pre tax earnings – minority interest x standardized 27% corporate tax rate. TTM earnings ignore the coronavirus restructuring charge taken in Q2.)
| Year | Sales | Earnings | Profit Margin |
| 2000 | $16.78 | $1.62 | 9.6% |
| 2001 | $17.05 | $1.45 | 8.5% |
| 2002 | $20.28 | $1.74 | 8.6% |
| 2003 | $22.95 | $1.88 | 8.2% |
| 2004 | $26.27 | $2.17 | 8.3% |
| 2005 | $29.03 | $2.42 | 8.3% |
| 2006 | $33.18 | $2.77 | 8.3% |
| 2007 | $38.94 | $3.30 | 8.5% |
| 2008 | $42.68 | $3.50 | 8.2% |
| 2009 | $38.03 | $2.83 | 7.4% |
| 2010 | $41.86 | $3.06 | 7.3% |
| 2011 | $49.72 | $3.77 | 7.6% |
| 2012 | $53.00 | $4.19 | 7.9% |
| 2013 | $56.33 | $4.34 | 7.7% |
| 2014 | $60.33 | $4.83 | 8.0% |
| 2015 | $61.98 | $4.99 | 8.1% |
| 2016 | $64.80 | $5.35 | 8.3% |
| 2017 | $65.75 | $5.60 | 8.5% |
| 2018 | $67.48 | $5.83 | 8.6% |
| 2019 | $68.03 | $6.12 | 9.0% |
| TTM | $62.93 | $5.59 | 8.9% |
Steady growth…
The Tortoise and the Hare
Large and small cap stocks can act a lot like the proverbial tortoise and the hare. They may both get to the same place in the end but the small cap stocks can take you on a much wilder ride, with periods of frenetic activity interspersed with years spent napping under a tree. In fact, you’re never quite sure if they’re even going to make it to the finish line. Omnicom looks more like the steady, reliable tortoise in this scenario. At least it has in the past.
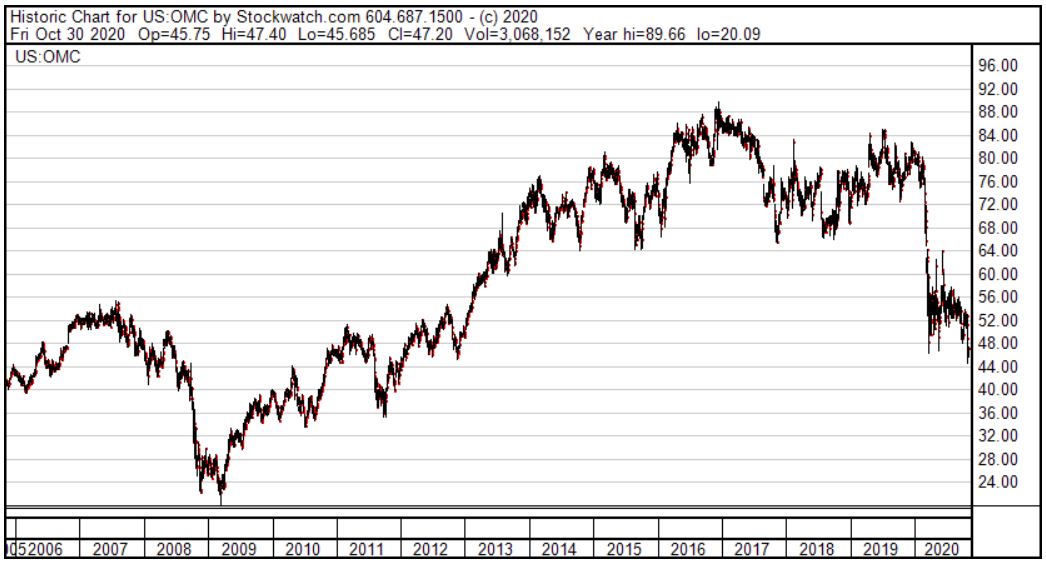
This was precisely the kind of thing I was looking for. Solid, steady growth over the past 20 years. Resilient performance through each of the last two recessions. (Sure, profits took a bit of a breather each time, but nothing compared to the bloodbath that many smaller companies experience.) Ignoring a restructuring charge the company took last quarter to deal with the coronavirus fallout, profits seem to have held up well during this downturn as well. In fact, the most recent third quarter earnings which just came out last week were actually above last year’s level. (In part, thanks to government support payments. Without these, earnings would have been modestly lower.) At the $47 range the stock was trading at, it looked like I could buy this puppy for only 7 times last year’s earnings or 8 times the current depressed trailing 12 month earnings. Definitely worth a closer look.
So what exactly was this $10 billion company I’d never heard of? Excel has a nifty new feature. You can plug in the ticker symbol of a company and it will spit back out a brief description of what the company does. Here is what Microsoft had to say about Omnicom…
Omnicom Group Inc. is a holding company. The Company provides advertising, marketing and corporate communications services. The Company’s branded networks and agencies operate in all markets around the world and provide a range of services, which it groups into four disciplines: advertising, customer relationship management (CRM), public relations and specialty communications. The Company caters to various industry sectors, such as food and beverage, consumer products, pharmaceuticals and healthcare, financial services, technology, travel and entertainment, telecommunications and retail. The Company’s branded networks and agencies conduct business on a global basis and operate in the geographic regions, such as The Americas, which includes North America and Latin America; EMEA, which includes Europe, the Middle East and Africa, and Asia Pacific, which includes Australia, China, India, Japan, Korea, New Zealand, Singapore and other Asian countries.
Welcome to Madison Avenue
Cool. An ad agency. Reminds me of a wasted youth spent watching reruns of Bewitched on TV. I dug a little deeper. 5000 clients, 70,000 employees. Operations in 50 countries worldwide (although 55% of revenues are earned on their home turf in the USA). I would have expected a big ad agency to suffer more during a recession as companies cut back on their marketing budgets to save money. But numbers don’t lie (well, okay yes they do, but in this case I think they’re legit). I guess size has its advantages.
The advertising world is undergoing a sea change right now. 50% of advertising has now moved online. Google search ads, social media influencers, youtube videos, e-commerce apps. It’s a brave new world out there for advertisers and I would be nervous that a big, traditional ad agency might not have the agility to adapt to this new world order. But looking carefully at their numbers, so far I don’t see any evidence that they are losing their edge. In fact, the company has said that these changes are playing right into their hands as the increased complexity and fragmentation of the industry encourages clients to seek out their help in navigating these unfamiliar waters.
This is not a high growth company. Earnings and sales have roughly doubled over the last 11 years, since the peak of the last business cycle. That is pretty much right in line with the average rate of growth of the S&P 500 over the last 50 years. At a p:e of 8, average growth is fine by me. But looking a little closer, growth might actually be better than it appears. This company pays out a large dividend and the stock currently yields around 5%. It has managed to generate decent growth in spite of paying out 40 cents on every dollar of its earnings to shareholders in the form of a dividend. That’s like holding your own in a sword fight with one arm tied behind your back. It’s accomplished that growth through a combination of buying back shares, bringing other ad agencies into the fold (acquisitions) and re-investing in organic growth.
Putting these numbers into some perspective, if we were to assume that the p:e ratio of this company were to forever stay mired in the single digit range, we could still earn a handsome return on our investment. If their earnings grow over the next business cycle at the same 5% that they did over the last cycle and if you add in the current dividend yield of 5%, you get a combined 10% annual rate of return. That compares very favourably to the 0% interest that you’re getting for cash in the bank or the negative real returns that you’re getting from government bonds nowadays or even the 3.7% current earnings yield of the typical S&P 500 stock. What’s more, if the p:e ratio were to ever re-rate back up to what I would consider a more reasonable 16 or so times earnings, you could quickly double your money on top of that.
On the balance sheet side, this is a large, stable company that can afford to carry a bit of extra leverage on its books. Debt is a bit higher than I usually like but is not at all egregious. In fact, if you are willing to overlook a couple of regularly recurring line items in the current liabilities section of their balance sheet which could probably be rightly viewed as part of the regular day to day operation of the business (customer advances and “other” current liabilities) then their net long term debt is actually very reasonable at less than 2 times earnings.
Time Well Spent
What started out as a bit of a time filler one evening, while I was waiting for some vegetables to roast in the oven, actually blossomed into a new addition to the portfolio. I like the diversification that this company brings to the table in terms of style, size and industry. So far, they seem to have weathered the covid storm fairly well. If we slide into a long, drawn-out recession in the aftermath of this thing then my hope is that Omnicom will retain its value better than most, given its performance through the last two recessions. I get to buy into this blue chip company at a very reasonable p:e of 8 and I get a nice dividend payout while I wait for better days to come.
Full disclosure: I own shares in Omnicom Group.